| StockFetcher Forums · General Discussion · Stan Weinstein's Secrets For Profiting in Bull and Bear Markets | << 1 ... 7 8 9 10 11 >>Post Follow-up |
| graftonian 1,089 posts msg #148814 - Ignore graftonian |
8/6/2019 9:09:19 PM Steve, I get confused easily, and writing code in the weekly mode really f***s me up. I assumed MA(150) was the same as weekly MA(30). But what do I know? |
| Mactheriverrat 3,178 posts msg #148815 - Ignore Mactheriverrat |
8/6/2019 9:25:26 PM Stan Weinstein would be shaking his head right about now. |
| Mactheriverrat 3,178 posts msg #148817 - Ignore Mactheriverrat modified |
8/6/2019 11:20:08 PM I've been studying ETF 's using what SF has to offer that were around in the 6/2007 to 6/2010 great recession using Stan Weinstein's Secrets For Profiting in Bull and Bear Markets theory . SF has some so far and Ive been using Fedility's Mutal funds screeners to search for Bond funds that were around that did good during the great recession. CAGR = Compound Annual Growth Rate PTTAX = CAGR / 9.85% VBiiX = CAGR / 8.08% 7/2007 to 6/2010 |
| roca1018 163 posts msg #148820 - Ignore roca1018 |
8/7/2019 5:40:19 AM Thanks so much for the feedback on JBLU Rich |
| graftonian 1,089 posts msg #148827 - Ignore graftonian modified |
8/7/2019 10:27:19 AM deleted |
| Mactheriverrat 3,178 posts msg #148831 - Ignore Mactheriverrat |
8/7/2019 12:53:30 PM Sector(Basic Materials) doing good again today - GOLD and mining stock. |
| xarlor 646 posts msg #148854 - Ignore xarlor |
8/9/2019 6:29:59 PM If you use wma(150) on daily chart, you have to use wma(30) on weekly chart (not ma(30)). Weinstein uses weighted moving average, which is wma. Below are the daily and weekly charts of SPY. Notice the wma lines are identical and cross the candles at the same price points on both charts. Daily SPY with wma(150): 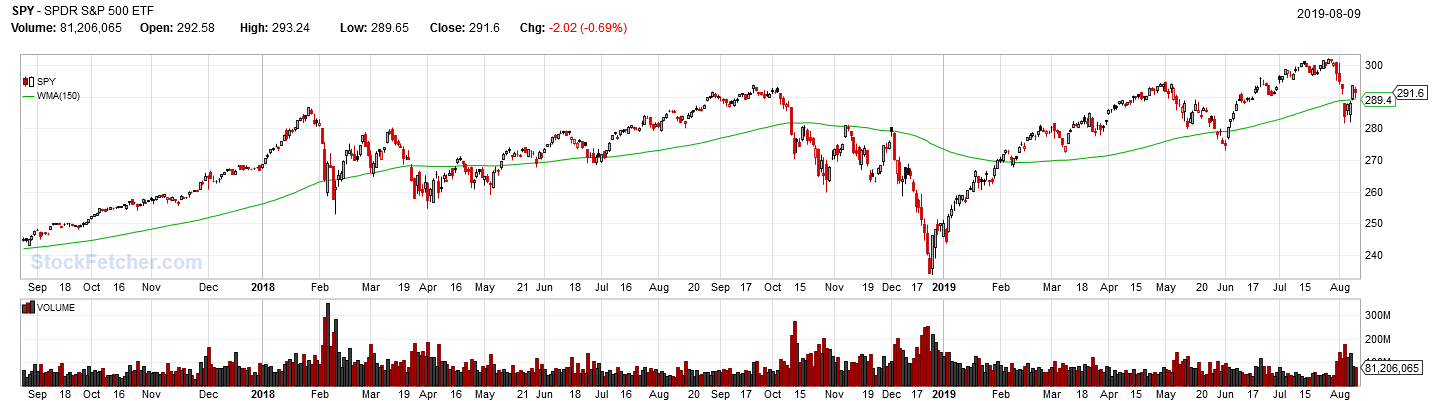 Weekly SPY with wma(30) 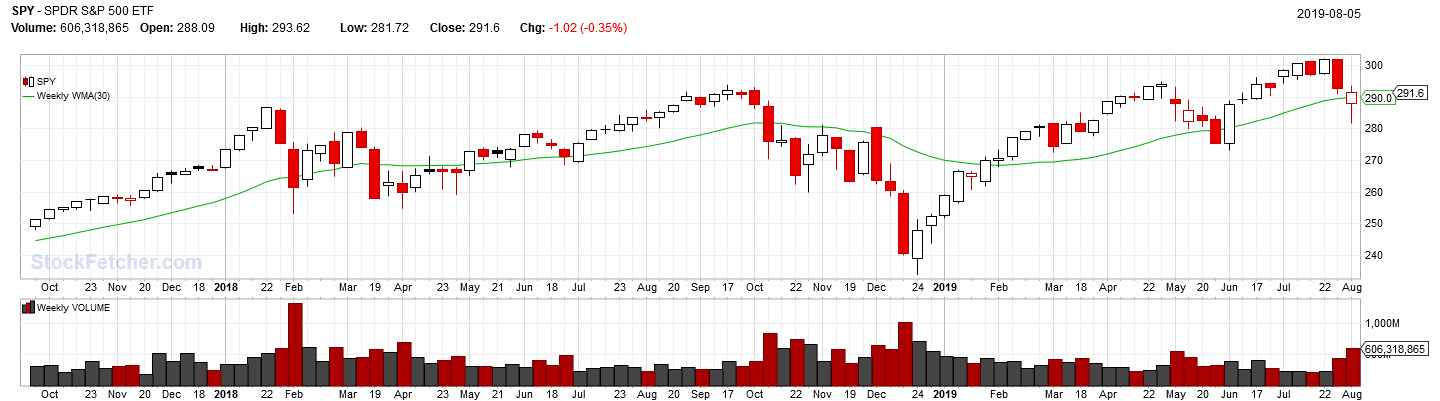 |
| nibor100 1,103 posts msg #148856 - Ignore nibor100 |
8/11/2019 12:56:57 PM I just got around to looking at the forum link that Mac posted earlier in this thread and it appears to be a gold mine of Weinstein data from a guy who has been using his method since at least 2011: Here is an interview he did with Stan Weinstein that tries to cover the overall market trading changes since the 1980s: Ed S. "05-08-2013, 04:12 PM Stan Weinstein Q&A Following Stan Weinstein's interview at the weekend on the Financial Sense Newshour I decided I would chance my arm at asking a range of questions that you've asked on here that I haven't been able to answer and some that I have myself. Well I'm glad to say that he replied and so below is our own mini Q&A with Stan Weinstein, that I hope helps everyone that are studying the method like I am. Quote: Q. The subject of volume comes up time and time again, as to it's importance in the method nowadays considering the rapid growth of Dark Pools, ETFs and Indexing, which all distort the volume data. So can I please ask if the way you view the volume data has changed over the years since the book and if there's anything we should be looking for specifically these days that's different from the books take on volume prior to and following a Stage 2A breakout? And on trader continuation breakouts within Stage 2? A. Volume on a breakout is still important (although perhaps a bit less so than a few decades ago), and I do want to see volume pick up on a breakout. Q. The book had a whole section on buy-stop orders, which I presume has been dropped over the years due to false breakouts that you would get these days? As I read your Technically Speaking interview from 1997 in which you were talking about buying a strong close above the breakout level, and also note in the GTA reports I've come across that you always say something like "A breakout (on a closing basis) above that level would be the signal to do buying". So I'm assuming that the buy-stop section from the book is now void, and that we should be looking to buy breakouts near the close of the day if they are above the breakout level and towards the high of the day? A. Because of the increasing amount of false breakouts, investors should only do buying when they see that the breakout isn’t false (and that it closes above the given level). However, a trader should do at least partial buying on an intraday basis when it breaks out above the given level (using a buy stop order), and then if at the end of the day it turns out to be false and it closes back below the level, then traders should immediately get out. But if not false and it hasn’t run too far, then later in the session, traders too can do additional buying. Q. Previous interview on Financial Sense Newshour - when did you reverse the bearish view you had in that interview and what were the reasons? As in the interview you were suggesting covering extended shorts and looking to do further shorting on the next rollover - which then began in late December, before the huge whipsaw at the start the year took us back into a Stage 2 again. So what changed your view that the short term bottom in November was actually more significant, as we were hoping that you were going to talk about that in the latest interview? A. I reversed my bearish stance starting in mid November (moving incrementally as I always do). I first turned short term bullish on November 16th when there was a “key reversal day” on good volume. Then in early December, we turned positive on the intermediate term trend too when the SPX cash, etc. moved above their respective 50 day moving averages (and there was a significant improvement in my S&P and Secondary Surveys). Finally, in early January we turned long term bullish also when the market broke out above key resistance, and the S&P and Secondary Surveys also turned clearly positive. Q. Secondary entry point following a Stage 2A breakout - how do you determine the entry point on the pullback? Do you suggest buying while the stock is still correcting, but is close to the original Stage 2A breakout level? Or should we wait until there's a clear reversal on a daily basis, following a test of the breakout level or close to the breakout level? Or something else? A. I suggest doing secondary buying when a stock pulls back close to the breakout point, and you then see it stabilize near that level. Q. Near term resistance/support - It was noted in the interview that you picked EXPE and AMZN as potential short candidates, but one of the members wanted to know why they were picked out considering the near term resistance they both have on the way down. For example on EXPE there's near term resistance in the 60-50 zone that it's currently in? I can see the other reasons that you might dislike it, in that 10 week MA is declining, the 30 week MA turned down this week also, but Fridays strong reversal turned it back up again; the Mansfield Relative Strength versus the S&P 500 is now below the zero line for the first time for a few years, and the negative volume is picking up. There's also a six month head shoulders pattern forming and so I have it as in Stage 3B at the moment with a breakdown to Stage 4A as a strong weekly close below 57? A. Although I’m not advocating a lot of short sells with the market so strong, I felt that EXPE was a good Stage 4A example of a stock that you should most definitely not be long, and if you were considering doing shorting, would be interesting on a rally back toward resistance in the 59-60 zone, and note on the latest rally, it’s failing right in that area near its 200 day moving average. As for why I’m so negative on it, it’s below its 50, 150, and 200 day moving averages and has broken significant support and is in Stage 4A. Q. Earnings - should stocks close to their earnings release be avoided until the data has been digested by the market? Any guidance on this would be welcome as it's a questions on earnings and how to deal with them are often raised. A. Traders should most definitely stay away from stocks that are coming out with earnings (especially in a market that is so over-reactive, such as this one). Q. Stock Prices - Adjusted or Unadjusted data? A lot of charting services adjust the stock charts for dividends, stock splits etc. Splits obviously have to be done, but adjusting the charts for dividends distorts the historical support and resistance levels important to the method. So should we use unadjusted charts were possible? This is also important to know with regards to continuous futures contracts, as for example the US 30 YearTreasuries charts are one of the major charts we follow as I manually copy and paste the price and volume data from the CME each week to get the most accurate chart possible. So I have pure unadjusted data, however, I've noticed some chart services adjust the data to remove the rollover gaps, but I think this distorts the support and resistance levels again? A. I suggest you use “adjusted” data. Q. Continuation moves during Stage 2 - relevance of volume on a continuation moves following a small consolidation of only a few months or so? Do you still look for the same requirements, or is it less important as long as the Stage 2A breakout previous to it fulfilled the at least two times the previous fours weeks average volume? A. Volume is less important on a continuation move in Stage 2 than it is on the original breakout but there should be at least some marginal increase in volume. Q. In the GTA reports you have short descriptions of all the sub-stages, which weren't in the book. Is there anywhere we can get detailed information on the sub-stages from? Also, the Stage 1 - Basing Phase. May begin accumulation has raised a few questions also. Like do you recommend someone using the investor method do any buying in Stage 1, and if so how to go about it? And the same question for people using the trader method, as I noticed in one of the interviews you mentioned that you recommended some trader buying even as early as Stage 4B- in some instances? A. I really don’t have “detailed information” on the “sub stages” that you ask about. It’s somewhat of a “gut feel” (obviously when a stock is first breaking out of a base and moving into Stage 2, I label it “Stage 2A” (early in the advancing phase). And after it’s been in that stage and becomes extended, I label it “Stage 2B” (late in the advancing phase). And if I just put a “Stage 2” rating on the stock, theoretically, I feel that it’s not yet ridiculously extended and is in the middle of its move (but again there are no “hard and fast” rules). Q. I follow a broad range of market breadth indicators as suggested in the book, like advance decline, momentum index, new highs new lows and many more to try and best replicate you weight of evidence approach with the resources I have and recently also added some economic datasets such as the S&P Case-Shiller Home Prices Index, which I note has just moved into Stage 2A. So my question is, do you think Stage Analysis can be used on economic data such as this? A. Yes, Stage Analysis can be used with economic data (such as your doing with the Case-Shiller Index), but I don’t suggest that you make that part of your “Weight of the Evidence” as the economic data will usually be “late”. Okay, David, that’s it. And now I wish you well in what is a very interesting and challenging market, and I hope that this input proves helpful to you, but understand that I can’t do this again as I have a very “heavy” and “tight” schedule. Best always, Stan Weinstein" |
| Mactheriverrat 3,178 posts msg #148857 - Ignore Mactheriverrat |
8/11/2019 1:47:18 PM Great post ED. |
| Mactheriverrat 3,178 posts msg #148858 - Ignore Mactheriverrat |
8/11/2019 1:51:24 PM Also another note from me- is If one can use ma150 on daily's to make $ then thats great too. Bottom line is if one can make $ from anything then that's GREAT because the odds in trading are stacked against you from the start. |
| StockFetcher Forums · General Discussion · Stan Weinstein's Secrets For Profiting in Bull and Bear Markets | << 1 ... 7 8 9 10 11 >>Post Follow-up |