StockFetcher Forums · General Discussion · Stan Weinstein's Secrets For Profiting in Bull and Bear Markets<< 1 ... 2 3 4 5 6 ... 11 >>Post Follow-up
Mactheriverrat
3,156 posts
msg #148398
Ignore Mactheriverrat
modified
7/6/2019 2:40:49 AM

@volvloe

Submit
Fetcher[ chart-time is 15 months
symlist(gol,htz,x,tsla)
set{ratio, close/ind(^ixic,close)}
/*200 for daily charts-52 for weekly*/
set{erat, cema(ratio,52)}
set{quo,ratio/erat}
set{dif,quo - 1}
set{MansfieldRS,dif*10}
draw MansfieldRS
add column MansfieldRS
draw MansfieldRS line at 0
chart-display is weekly
Draw weekly ma(30)


]


davesaint86
725 posts
msg #148409
Ignore davesaint86
7/7/2019 12:10:50 AM

code from TradingView

//@version=3

// Use this indicator to compare how security is performing in compare with prefered index (SPX by default).
// > 0 outperforming
// < 0 underperforming
// Works best for weekly, but can be applied to monthly and daily charts. It will be rather useless to use it in smaller timeframes
// Apply it to SPX, industry index, sector index or other security in similar sector

// UPDATE 1: Added sector and industry as optional params. Leave them same as index if you don't want to use them

study("Mansfield Relative Strength indicator")

index = input(title="Index", type=symbol, defval="SP:SPX")
sector = input(title="Sector (optional)", type=symbol, defval="SP:SPX")
industry = input(title="Industry (optional)", type=symbol, defval="SP:SPX")

ma_type = input(title="Which moving average to use?", defval="SMA", options=["SMA", "WMA", "EMA"])
len_daily = input(title="MA length for Daily", defval=200)
len_weekly = input(title="MA length for Weekly", defval=52)
len_monthly = input(title="MA length for Monthly", defval=10)
len_other = input(title="MA length for all other periods", defval=52)
val = close


len = period == "W" ? len_weekly : (period == "D" ? len_daily : (period == "M" ? len_monthly : len_other))

ma_func(x, length) =>
ma_type == "WMA" ? wma(x, length) : (ma_type == "SMA" ? sma(x, length) : ema(x, length))


calc_mrs_func(x, ind, length) =>
((x / security(ind, period, x)) / ma_func((x / security(ind, period, x)), length) - 1) * 10


mrs_index = calc_mrs_func(val, index, len)
mrs_sector = calc_mrs_func(val, sector, len)
mrs_industry = calc_mrs_func(val, industry, len)
c = sign(mrs_index) + sign(mrs_sector) + sign(mrs_industry)

bgcolor(c == 3 ? color(green, 80) : c == 2 ? color(green, 75) : c == 1 ? color(green, 70) : c == -1 ? color(red, 70) : c == -2 ? color(red, 75) : c == -3 ? color(red, 80) : gray)
plot(mrs_index, linewidth=3, title="MRS index")
plot(mrs_sector != mrs_index ? mrs_sector : na, linewidth=2, title="MRS sector")
plot(mrs_industry != mrs_index ? mrs_industry : na, linewidth=1, title="MRS industry")
hline(price=0, linestyle=dashed, title="Zero baseline")

davesaint86
725 posts
msg #148413
Ignore davesaint86
7/7/2019 11:33:49 AM

https://www.tradingview.com/x/MwjLOJFP/

https://www.tradingview.com/x/7S4tx1oq/

Mactheriverrat
3,156 posts
msg #148505
Ignore Mactheriverrat
modified
7/13/2019 8:45:00 PM

Submit
Fetcher[

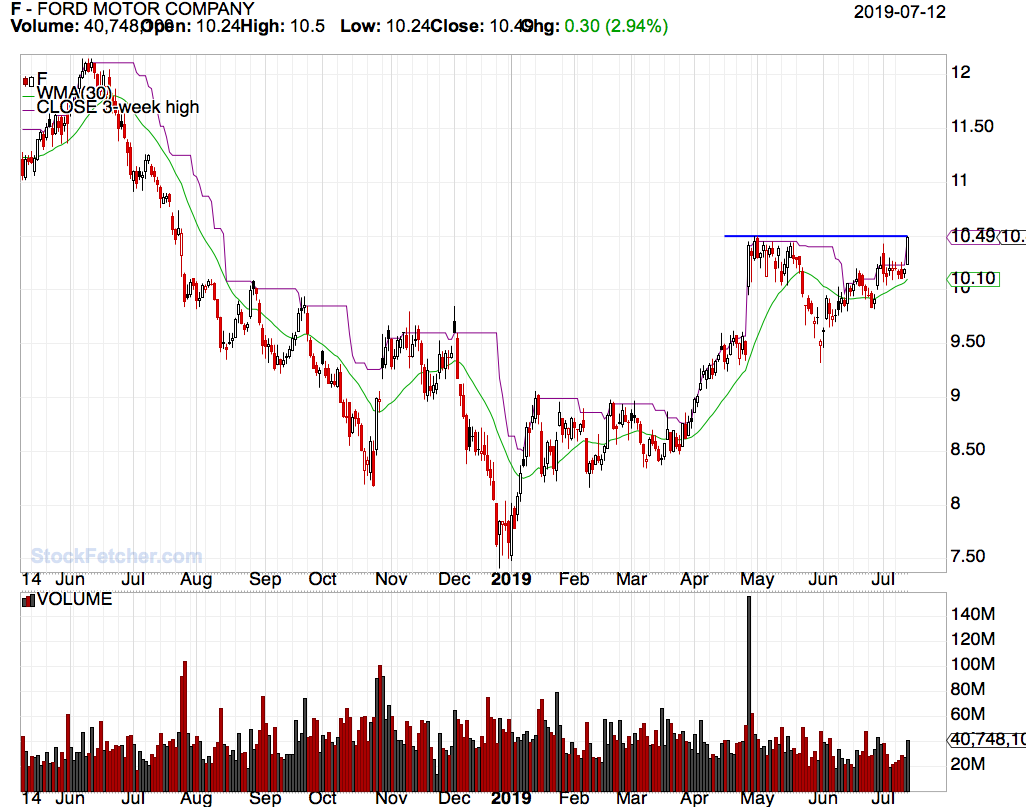
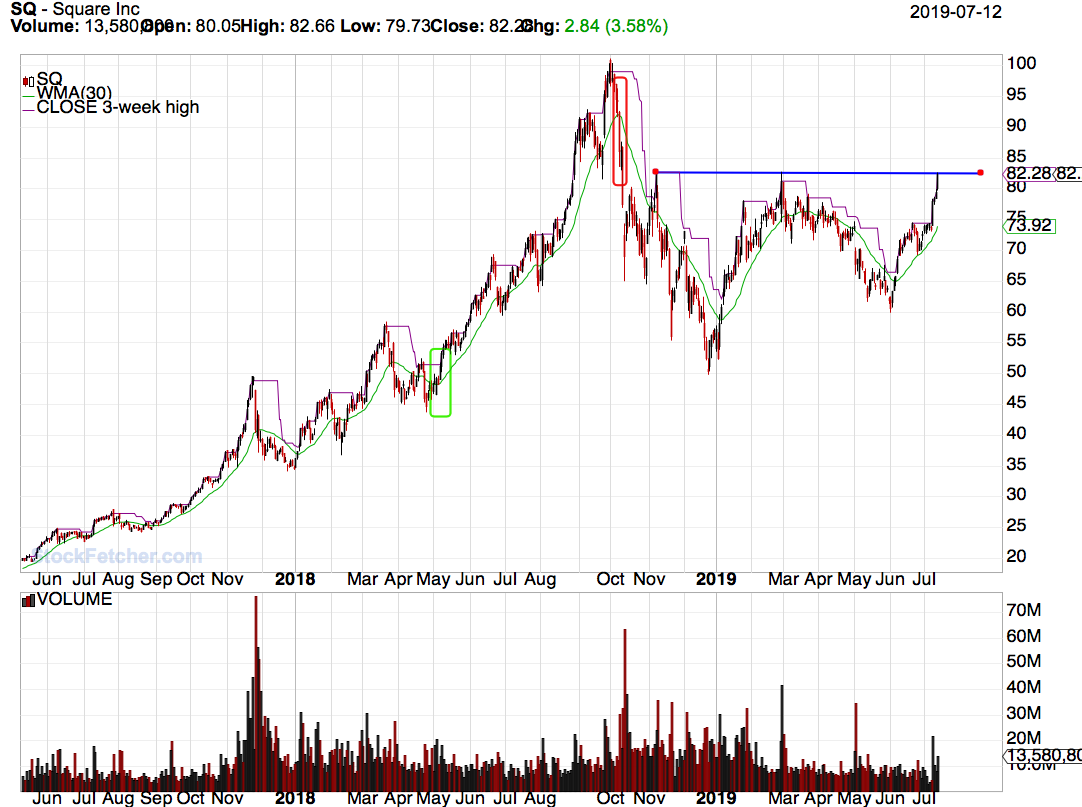
/* The "close equal close 3 week high" of this filter will show stocks that are equal to the close of its weekly 3 week high. A glance of charts will give lots of near resisitace breakout setups. Version 1.2 - free to change as you want or add indicators as you want. Its a basic filter and its really all you need.*/
close above weekly wma(30)
volume above 250000
Chart-display is weekly
close equal close 3 week high
market is not otcbb
market is not etf
add column Average Day Range(30)
and Average Day Range(30) is above 1.50
do not draw Average Day Range(30)
]


You should see charts like this


davesaint86
725 posts
msg #148506
Ignore davesaint86
modified
7/13/2019 9:30:19 PM

I found the Weinstein filter on ChartMill and here is their current list. Many of these stocks are still in stage 2.

Fetcher[
apply to symlist(ALK, ALLO, ALXN, AMLP, ARW, BEN, BJ, BMRN, CAH, CAT, CBD, CBOE, CCJ, CGC, CGNX, CNP, COG, COT, CPB, CVX,DKS, DOC, DOCU, EIDO, EIX, ELAN, ENBL, ESPR, ETRN, EXEL, FMC, FRC, FWONK, GM, GOLD, HOG, HOLX, HRB, HTA, HTZ,IFF, IIVI, ILF, IRM, ITW, IYZ, JACK, JBLU, JEF, JNPR, KMT, KRG, LC, LEG, LUV, MGY, MPLX, NTES, NUAN, NVO, NVT, OI, OMC, ORAN, PAA, PAGP, PDCO, PDM, PEGI, PH, PM, PPL, PRSP, PZZA, REG, REGN, REZI, ROIC, ROK, RPAI, SNY, SOI, STNE, SVXY, SYMC, TAP, TENB, TGS, TMUS, UPWK, VIV, VNO, WRI, WYND, XOM, ZBH, ZVZZT)


Chart-display is weekly
draw Average Volume(30) line at ema(20)

draw weekly wma(4)
draw weekly wma(10)

draw weekly wma(30)
set{x1, compare with ^SPX}
draw x1 line at 0
set{x2, cma(x1,52)}
draw x2 on plot x1
add column Relative Strength(^SPX,150)
/* wma30 is number of consecutive days wma(30) above (+)/below(-) previous wma(30) */
set{3030b,days( weekly wma(30) is above weekly wma(30) one week ago ,250)}
set{3030a,days( weekly wma(30) is below weekly wma(30) one week ago ,250)}
set{3030, 3030a - 3030b} and add column 3030 {3030}
do not Draw 3030
Chart-display is weekly
set{cnt3030,count( weekly wma(30) > weekly wma(30) one week ago ,1)}
draw cnt3030

Set{cnt3030b,count( weekly wma(30) < weekly wma(30) one week ago ,1)}

draw cnt3030b
set{ratio, close/ind(^ixic,close)}
/*200 for daily charts-52 for weekly*/
set{erat, cema(ratio,52)}
set{quo,ratio/erat}
set{dif,quo - 1}
set{MansfieldRS,dif*10}
draw MansfieldRS
add column MansfieldRS
draw MansfieldRS line at 0

/* w4 is number of consecutive days weekly wma(4) above (+)/below(-) previous weekly wMA(4) */
set{w4b,days( weekly wma(4) is above weekly wMA(4) one week ago ,25)}
set{w4a,days( weekly wma(4) is below weekly wMA(4) one week ago ,25)}
set{w4, w4a - w4b} and add column w4 {w4}
do not Draw w4

Set{cntwma4crossabovewma4,count( weekly wMA(4) > weekly wMA(4) one day ago ,1)}
draw cntwma4crossabovewma4

Set{cntwma4crossabovewma4b,count( weekly wMA(4)< weekly wMA(4) one day ago ,1)}

draw cntwma4crossabovewma4b
add column separator


/* w10 is number of consecutive days weekly wma(10) above (+)/below(-) previous weekly wMA(10) */
set{w10b,days( weekly wma(10) is above weekly wMA(10) one week ago ,250)}
set{w10a,days( weekly wma(10) is below weekly wMA(10) one week ago ,250)}
set{w10, w10a - w10b} and add column w10 {w10}
do not Draw w10
add column separator
Set{cntwma10crossabovewma10,count( weekly wMA(10) > weekly wMA(10) one day ago ,1)}
draw cntwma10crossabovewma10

Set{cntwma10crossabovewma10b,count( weekly wMA(10)< weekly wMA(10) one day ago ,1)}

draw cntwma10crossabovewma10b


/* w30 is number of consecutive days weekly wma(30) above (+)/below(-) previous weekly wMA(30) */
set{w30b,days( weekly wma(30) is above weekly wMA(30) one week ago ,250)}
set{w30a,days( weekly wma(30) is below weekly wMA(30) one week ago ,250)}
set{w30, w30a - w30b} and add column w30 {w30}
do not Draw w30
add column separator
Set{cntwma30crossabovewma30,count( weekly wMA(30) > weekly wMA(30) one day ago ,1)}
draw cntwma30crossabovewma30

Set{cntwma30crossabovewma30b,count( weekly wMA(30)< weekly wMA(30) one day ago ,1)}


set{E30, price above weekly ma(4)}
set{D5Longposition, count(E30 > 0,1)}
set{D5Shortposition, count(E30 < 0,1)}
SET{D5TRIGGER,0}

set{E10, price above weekly ma(10)}
set{D10Longposition, count(E10 > 0,1)}
set{D10Shortposition, count(E10 < 0,1)}
SET{D10TRIGGER,0}


set{E25, price above weekly ma(30)}
set{D100Longposition, count(E25 > 0,1)}
set{D100Shortposition, count(E25 < 0,1)}
SET{D100TRIGGER,0}


set{CRS1, rsi(7),1)}
set{CRS2, rsi(14),1)}
set{CRS3, rsi(21),1)}
set{CCRS1, CRS1 + CRS2}
set{CCRS2, CCRS1 + CRS3}
set{CCRS3, CCRS2 /3}

set{CRS4, weekly rsi(7),1)}
set{CRS5, weekly rsi(14),1)}
set{CRS6, weekly rsi(21),1)}

set{WCRS1, CRS4 + CRS5}
set{WCRS2, WCRS1 + CRS6}
set{WCRS3, WCRS2 /3}
set{CWRSI1, CCRS3 + WCRS3}
set{C-RSI, CWRSI1 /2}
set{RSI21, RSI(21) - 50}
set{CRSI_Bar, RSI21}
PlotType{CRSI_Bar,zerobar}

set{RSI14, RSI(14) - 50}
set{RSI14_line, RSI14}


set{RSI7, RSI(7) - 50}
set{RSI7_line, RSI7}


set{drsilong1, count(rsi(21) above 0, 1)}
set{drsilong2, count(rsi(14) above rsi(21), 1)}
set{drsilong3, count(rsi(7) above rsi(21), 1)}
set{drsilong4, drsilong1 + drsilong2}
set{drsilong5, drsilong4 + drsilong3}
set{drsilong, count(drsilong5 equals 3, 1)}
set{drsishort, count(drsilong5 less than 3, 1)}
SET{DRSITRIGGER,0}


set{wrsi1, weekly rsi(7)}
set{wrsi2, weekly rsi(21)}
set{wrsi3, count(wrsi1 > wrsi2,1)}
set{wrsilong, count(wrsi3 equals 1, 1)}
set{wrsishort, count(wrsi3 less than 1, 1)}


set{CRS21, ROC(21,1)}
set{CRS63, ROC(63,1)}
set{CRS126, ROC(126,1)}
set{CR1, CRS21 + CRS63}
set{C-RS, CR1 + CRS126}

Set{W21, CRS21 * .33}
Set{W63, CRS63 * .33}
Set{W126, CRS126 * .34}
set{rw1, w21 + w63}
set{rw-c, rw1 + w126}


set{wsto, weekly Slow Stochastics(14,3)}
set{dsto, Slow Stochastics(14,3)}
set{wdsto, wsto + dsto}
set{CSTO, wdsto / 2}
set{TWRSI7, weekly RSI(7)}
set{TWRSI14, weekly RSI(14)}
set{TWRSI21, weekly RSI(14)}
set{TWRSI1, TWRSI7 + TWRSI14}
set{TWRSI2, TWRSI1 + TWRSI21}
set{A-WRSI, TWRSI2 / 3}
set{TDRSI7, RSI(7)}
set{TDRSI14, RSI(14)}
set{TDRSI30, RSI(21)}
set{TDRSI1, TDRSI5 + TDRSI13}
set{TDRSI2, TDRSI1 + TDRSI30}
set{A-DRSI, TDRSI2 / 3}


add column D5Longposition {wMA4}
add column separator
add column D10Longposition {wMA10}
add column separator

add column D100Longposition {wMA30}
add column separator


add column csto
ADD COLUMN SEPARATOR
add column c-rsi
ADD COLUMN SEPARATOR


SORT COLUMN 22 desCENDING


chart-time is two years
]


Mactheriverrat
3,156 posts
msg #148507
Ignore Mactheriverrat
7/13/2019 9:40:28 PM

@davesaint86
Chartmill is another great site. Kudo's on your filter.

I like Weinstein's way of finding trends on the weekly charts.

volvlov
32 posts
msg #148508
Ignore volvlov
7/13/2019 9:44:37 PM

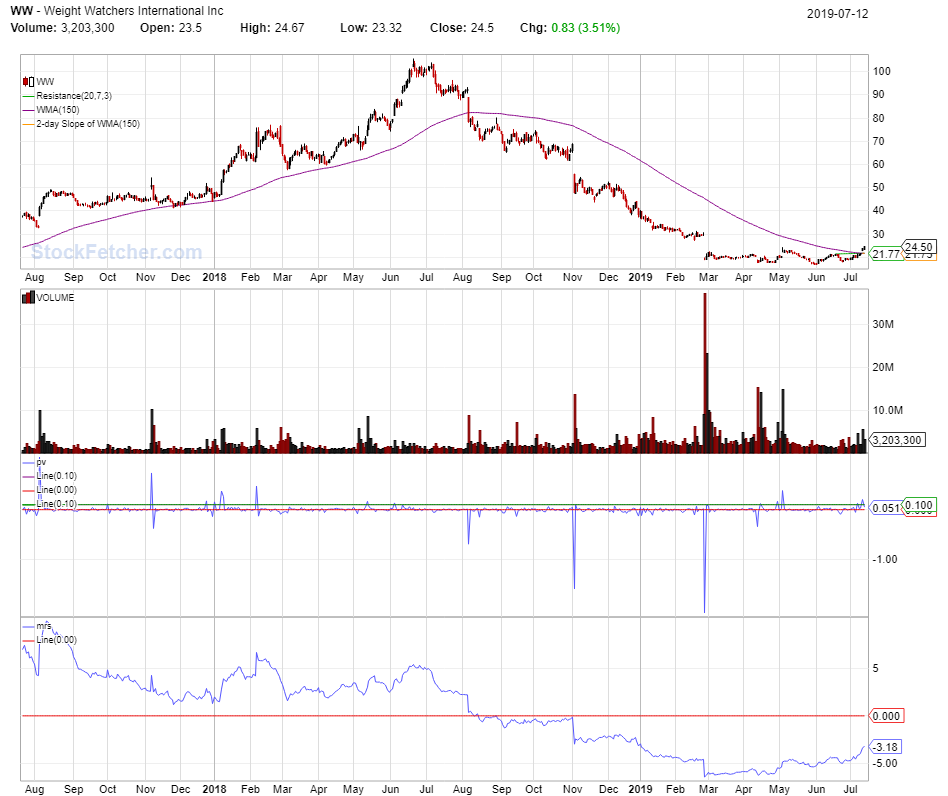
I am going to watch this one closely next week.


Mactheriverrat
3,156 posts
msg #148509
Ignore Mactheriverrat
7/13/2019 10:00:21 PM

WW has a history of being explosive past on a weekly basis.


lemmy
12 posts
msg #148510
Ignore lemmy
7/14/2019 9:16:59 AM

Stan Weinstein's book was the first book I'd ever bought about trading and/or technical analysis, and it is still my favorite. I consider it a "must have" in one's trading library.

ron22
255 posts
msg #148512
Ignore ron22
7/14/2019 11:14:36 AM

davesaint86, Chartmill is a great site. I just joined. Your filter gives 96 matches. How do you narrow it down

to 10-20 for a watchlist? Also, what do you use for entry and exit triggers? Thank you for your input.

StockFetcher Forums · General Discussion · Stan Weinstein's Secrets For Profiting in Bull and Bear Markets<< 1 ... 2 3 4 5 6 ... 11 >>Post Follow-up

*** Disclaimer *** StockFetcher.com does not endorse or suggest any of the securities which are returned in any of the searches or filters. They are provided purely for informational and research purposes. StockFetcher.com does not recommend particular securities. StockFetcher.com, Vestyl Software, L.L.C. and involved content providers shall not be liable for any errors or delays in the content, or for any actions taken based on the content.


Copyright 2022 - Vestyl Software L.L.C.Terms of Service | License | Questions or comments? Contact Us
EOD Data sources: DDFPlus & CSI Data Quotes delayed during active market hours. Delay times are at least 15 mins for NASDAQ, 20 mins for NYSE and Amex. Delayed intraday data provided by DDFPlus


This site is protected by reCAPTCHA and the Google Privacy Policy and Terms of Service apply.