| StockFetcher Forums · General Discussion · Lots of good setups coming up on scans showing up | << 1 2 3 4 >>Post Follow-up |
| Mactheriverrat 3,178 posts msg #145899 - Ignore Mactheriverrat |
1/7/2019 8:49:32 AM @ron Your welcome. I think its a good trigger. Like all setups it may not work every time but its working for me. |
| nibor100 1,103 posts msg #145901 - Ignore nibor100 |
1/7/2019 11:06:15 AM @Mactheriverrat and Ron22, 1. It looks like the reason the filter was not clickable as originally posted was the use of the Exclamation symbol " ! ". Became clickable after I removed it as seen down below with all of the original comment text: 2. By the way, anytime anyone wants to double check if their post actually has a clickable filter, choose the Preview Message box below the Message text entry box and you'll be taken to your post as it would appear after being actually posted: i.e. with the filter colored blue and the popup charts ... if it is indeed clickable. a. If you like what you see, then scroll down to the bottom of the page and choose the Post Message box. b. If you don't like what you see or need to do more stuff before you post, choose the Continue Editing Box. Ed S. |
| Mactheriverrat 3,178 posts msg #145904 - Ignore Mactheriverrat |
1/7/2019 1:40:43 PM Thanks Nibor Everything looks great! |
| ron22 255 posts msg #145906 - Ignore ron22 |
1/7/2019 4:48:53 PM Thanks Ed. |
| Mactheriverrat 3,178 posts msg #145907 - Ignore Mactheriverrat |
1/7/2019 5:04:36 PM LULU is a prime example of the ema4 cross ema21 , draw downtrend lines, the ema4 cross today of ema40 and breakout above downtrend line , a ema9 cross of ema40 on a follow through tomorrow or wednesday. All the longer term moving averages are turning upward. 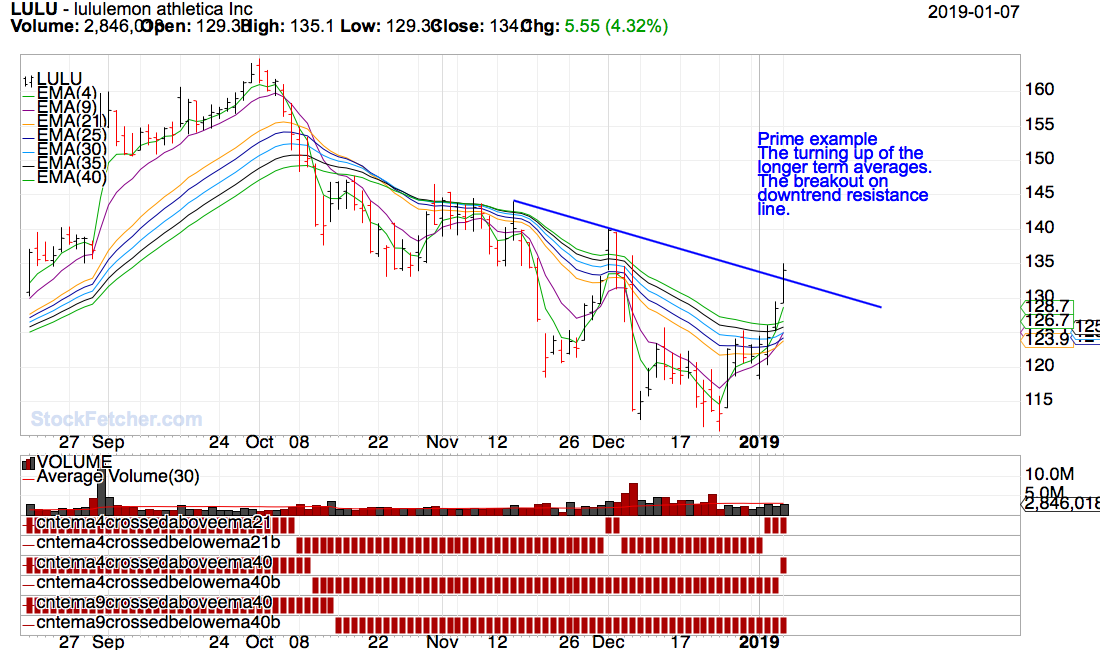 |
| ron22 255 posts msg #145908 - Ignore ron22 |
1/7/2019 10:54:58 PM Mac, I assume that average volume is okay. Higher volume is a bullish plus but not a requirement. Right? |
| Mactheriverrat 3,178 posts msg #145909 - Ignore Mactheriverrat |
1/7/2019 11:57:01 PM Yes that average volume is okay. Higher volume is a bullish plus but not a requirement. One can even change all the volume's on the filter to one or what amount a person wants. Your wanting to sort the most recent ema4 cross ema21. Draw your down trend resistance lines. Watch or look for the tuning up ema21,25,30,,35,40. Then the next day price may cause a ema4 cross ema40 . Watch the price . Has it crossed above resistance line , has ema21,25,30,,35,40 turned up more from yesterday. Then by the time you have a ema9 cross ema40 the price more than not has broken the down trend line. ( BREAKOUT!) The ema21,25,30,,35,40 are starting to go up even more. Its like the whole sequence's are talking to you. |
| Mactheriverrat 3,178 posts msg #145910 - Ignore Mactheriverrat |
1/8/2019 3:09:59 AM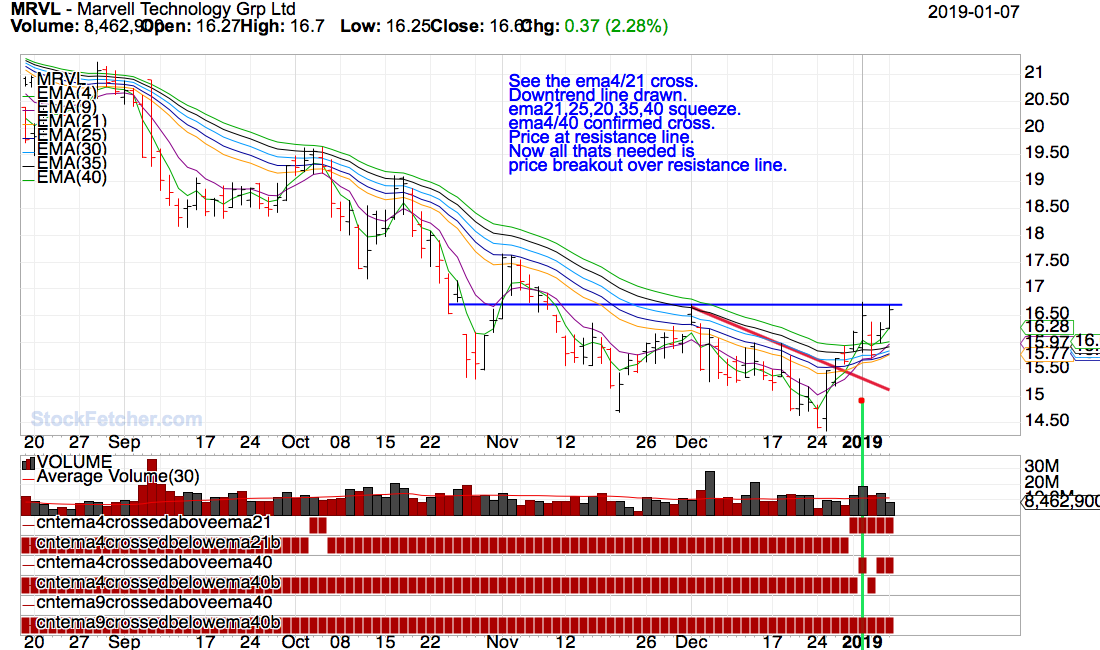 |
| ron22 255 posts msg #145911 - Ignore ron22 |
1/8/2019 8:38:25 AM Thank you Mac. I am getting better at reviewing charts but I still need more practice. |
| Mactheriverrat 3,178 posts msg #145925 - Ignore Mactheriverrat |
1/8/2019 1:27:16 PM @ron22 Thank you. Its takes keep looking at what works through the price action. 1000's of charts and 1000 ways to trade the markets. If one finds a way to make $ then stick with until something better comes along. IMHO! |
| StockFetcher Forums · General Discussion · Lots of good setups coming up on scans showing up | << 1 2 3 4 >>Post Follow-up |