| StockFetcher Forums · General Discussion · Lots of good setups coming up on scans showing up | << 1 2 3 4 >>Post Follow-up |
| Mactheriverrat 3,178 posts msg #145929 - Ignore Mactheriverrat |
1/8/2019 4:34:43 PM Using this type of trigger system one can see on MEET that its about at 52 week high on above average volume. That being said that this say setup is that other traders are seeing this on their own scans looking for stocks to buy on possible breakouts. 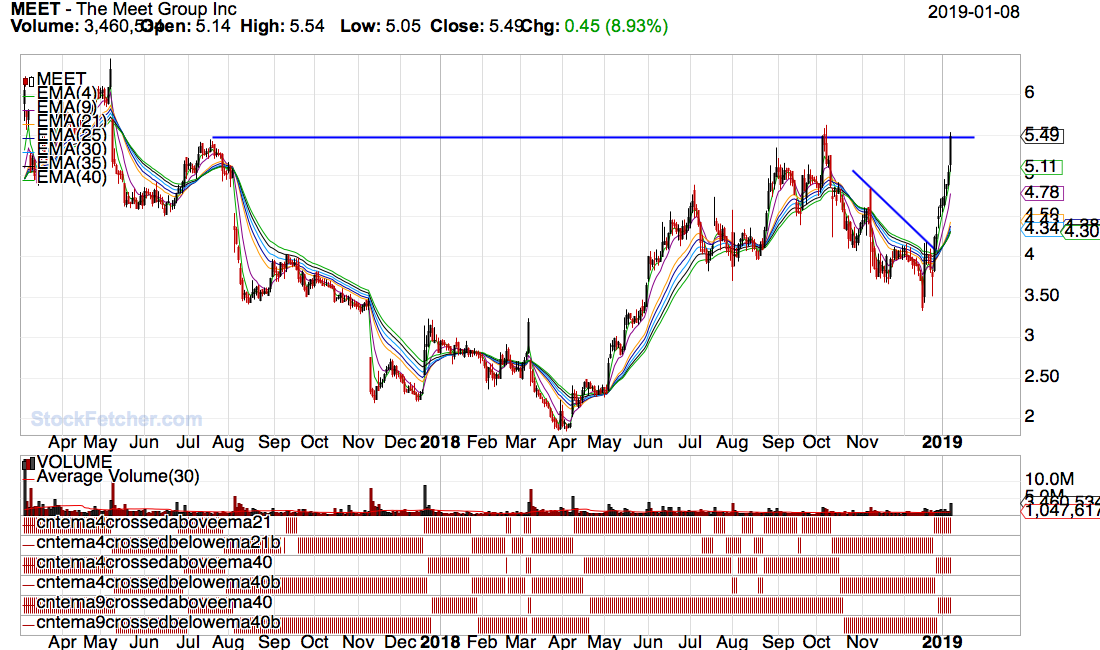 |
| Mactheriverrat 3,178 posts msg #145937 - Ignore Mactheriverrat |
1/9/2019 2:03:54 AM Changed filter -as too many returns popping up Price above 1 and price below 40 Average Volume(30) above 200000 and maybe change the ARD(30) to 4.00. Most of the original filter was from 13th_floors Deadly combo filter. Guess one can change the filter to what ever they like. -------------------- One this about it all is more stocks are showing up because the markets getting a little more Bullish each day. |
| Mactheriverrat 3,178 posts msg #145939 - Ignore Mactheriverrat |
1/9/2019 6:28:52 AM TNDM 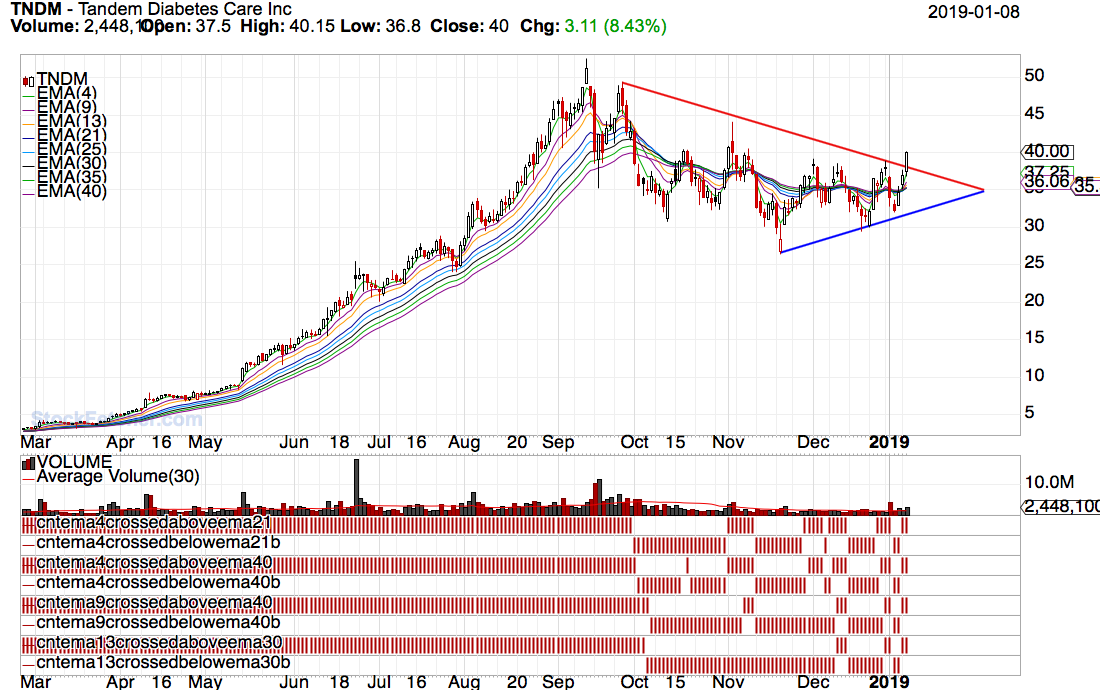 |
| four 5,087 posts msg #145945 - Ignore four |
1/9/2019 1:04:13 PM Mac, on TNDM … I sold yesterday... wish you posted earlier ;) maybe I'll get back in... |
| dashover 229 posts msg #145949 - Ignore dashover modified |
1/9/2019 3:15:33 PM Mac, Do you find you use all those histograms on the bottom or mostly just a short 4/21 and a 9/40? https://wishingwealthblog.com/2019/01/aapls-woes-telegraphed-in-november-long-before-wednesdays-news-came-out/ Ever read his guppy work? or https://stockcharts.com/articles/dancing/2017/11/zahorchak-revisited.html He uses the weekly 5/15/40 which is approx. daily 20/75/200 ... My favorite book was written by Zahorchak.. How did you decide on 4/21 9/40 3/15 etc? Just Curious... Thanks! for this great filter! Dash |
| Mactheriverrat 3,178 posts msg #145961 - Ignore Mactheriverrat modified |
1/10/2019 6:36:36 AM /* The first real signal is a ema4 cross ema9. When the EMA4 cross's the EMA21 which you sort by ema421 by most recent. Draw your downtrend resistane lines. Start watching the longer term ema21,25,30,35,40 turn up. Next Bullish flag will be the ema4 cross above ema40 while watching the longer term avarages keep turning up. watch price to see if breaks above downtrend line. If price breaks above downtrend line, chance's are it will be a breakout. The last ema9 cross above above ema40 takes place and more than not the down trend has changed to a up trend. Longer term averages are turning and and starting to squeeze in a Guppy MMA turn. Also watch out for higher volume as other trader,s buy in means its Bullish! Don't Over analyze as it will become Analysis paralysis . Keep it plain and simple. */ |
| dashover 229 posts msg #145970 - Ignore dashover |
1/10/2019 11:35:15 AM It seems 100% of your charts have at least ema440 > 0 Would you concur? |
| Mactheriverrat 3,178 posts msg #145971 - Ignore Mactheriverrat modified |
1/10/2019 11:58:32 AM I'm using the EMA cross's with the longer term EMA'S turning up which are a change in trends. There's no one cross buy a process of events |
| Mactheriverrat 3,178 posts msg #146089 - Ignore Mactheriverrat |
1/16/2019 3:43:12 AM TNDM Rising. 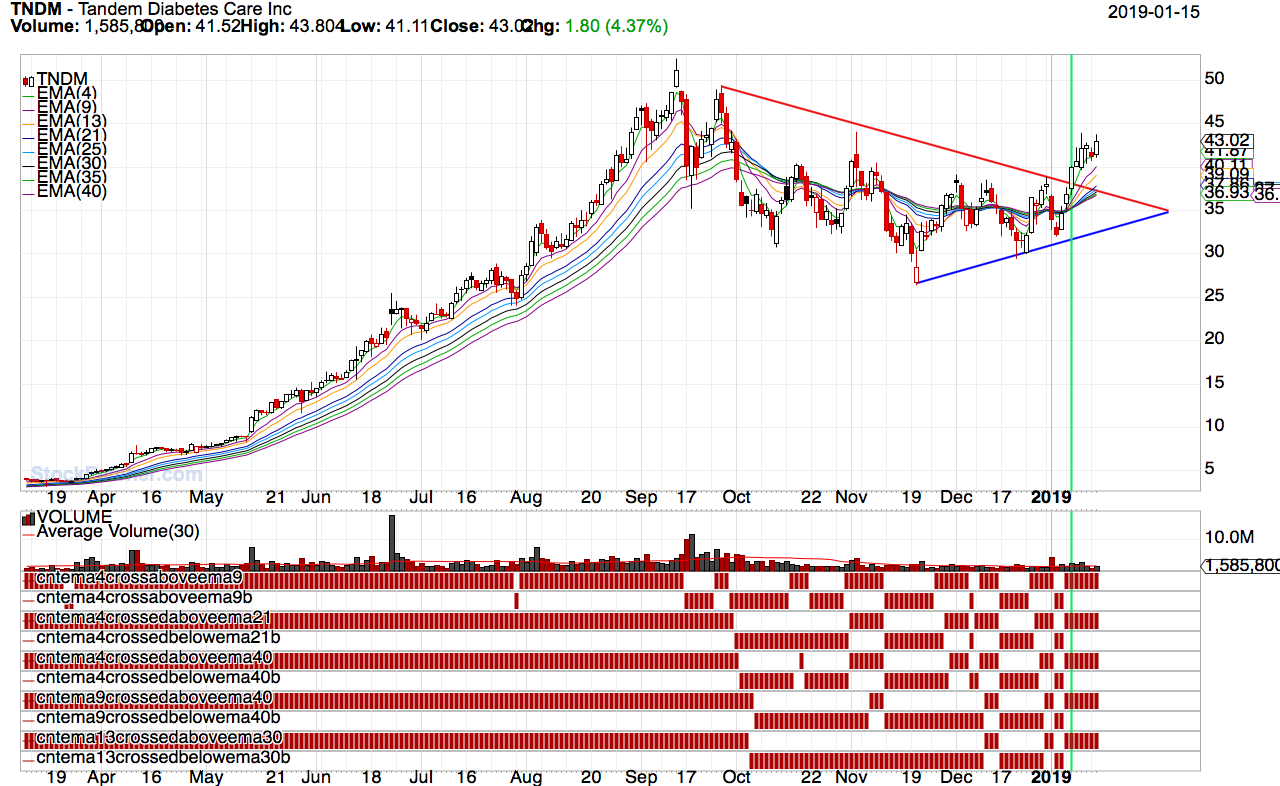 |
| Mactheriverrat 3,178 posts msg #146143 - Ignore Mactheriverrat |
1/18/2019 4:05:19 PM Nice buy in today on ALDR . I didn't get the best buy in price but I will take it in this trend change stock. 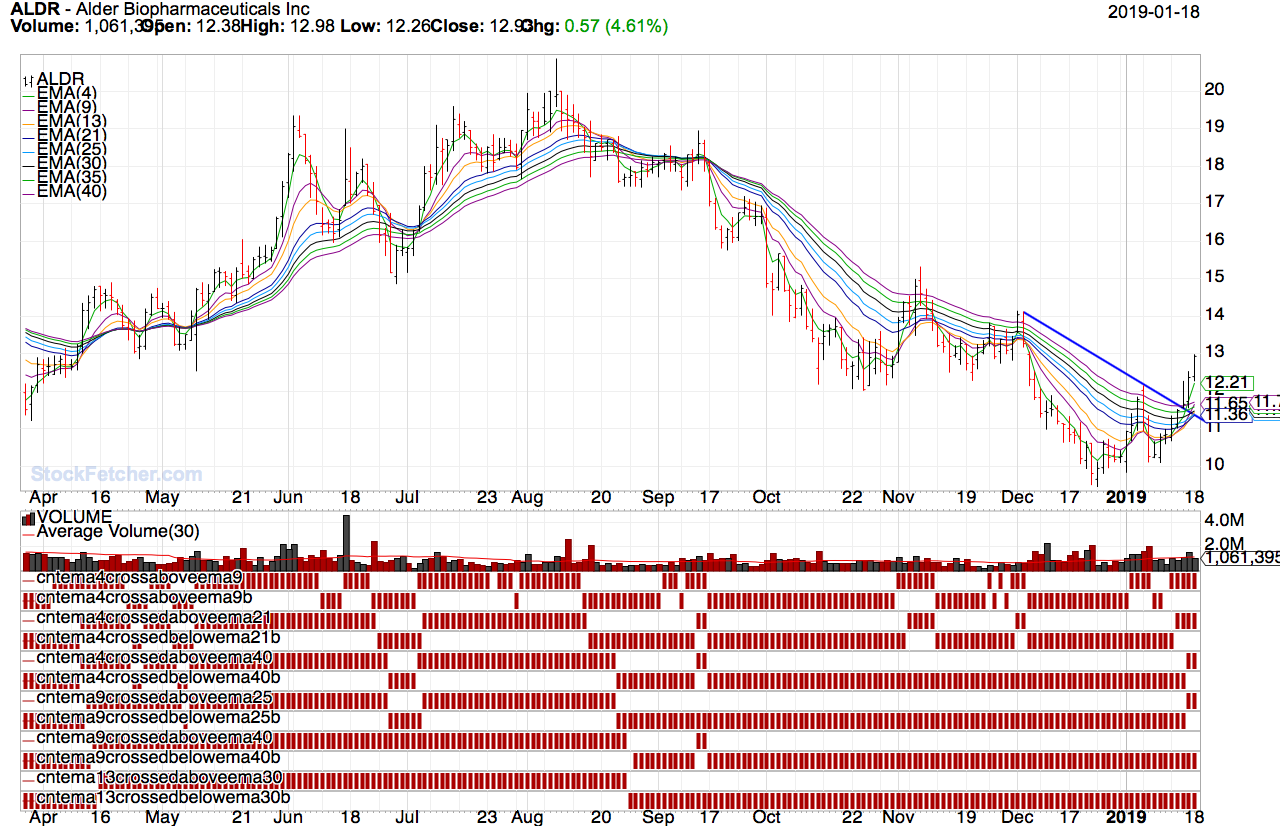 |
| StockFetcher Forums · General Discussion · Lots of good setups coming up on scans showing up | << 1 2 3 4 >>Post Follow-up |