| StockFetcher Forums · General Discussion · Breakout Trading Webinar (Kunal Desai) - owner of BullsonWallstreet. | << 1 2 3 4 >>Post Follow-up |
| Mactheriverrat 3,178 posts msg #154628 - Ignore Mactheriverrat |
11/16/2020 1:55:21 AM |
| snappyfrog 749 posts msg #154636 - Ignore snappyfrog |
11/16/2020 8:12:19 PM Good video |
| Mactheriverrat 3,178 posts msg #154638 - Ignore Mactheriverrat |
11/16/2020 11:24:52 PM Damm good video!!!! |
| Mactheriverrat 3,178 posts msg #154647 - Ignore Mactheriverrat |
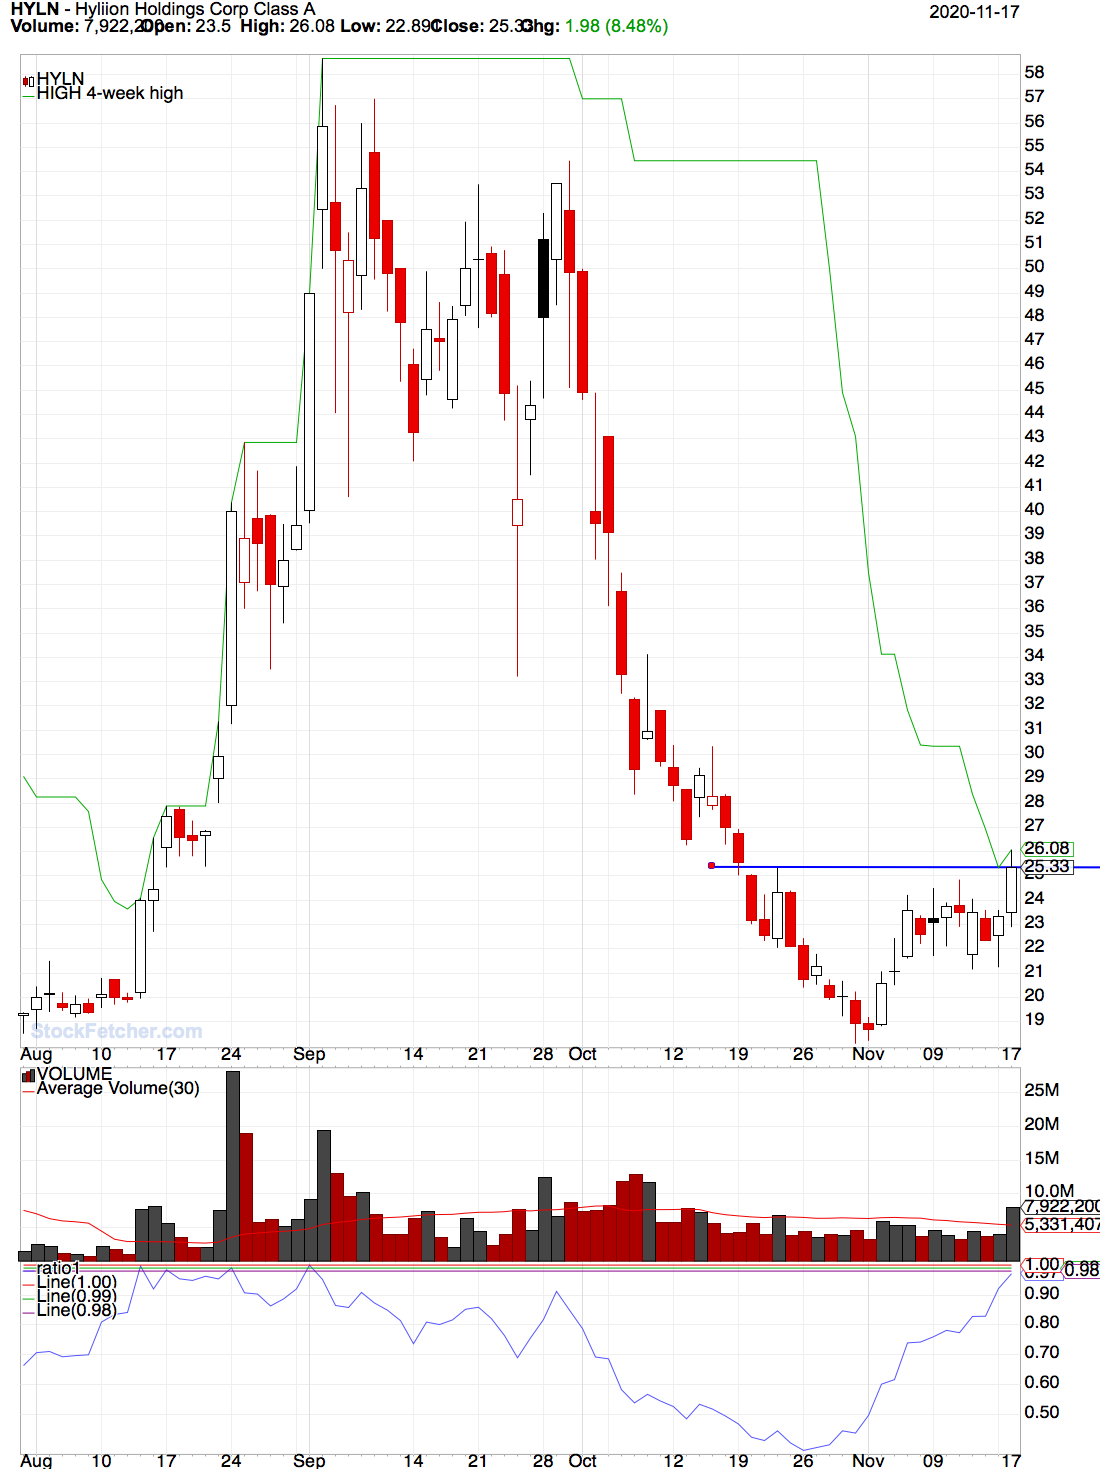
11/17/2020 2:12:13 PM Draw high 4 week high set{ratio1, price / above high 4 week high } and add column ratio1 and add column ratio1 one day ago draw ratio1 line at 1.00 draw ratio1 line at 0.99 draw draw ratio1 line at 0.98 -------------------------------- sort column from 1.00 downwards. See where price is setting up to breakout of high 4 week high. |
| Cheese 1,374 posts msg #154653 - Ignore Cheese |
11/17/2020 9:32:17 PM Thank you very much, Mac |
| Mactheriverrat 3,178 posts msg #154654 - Ignore Mactheriverrat |
11/18/2020 5:57:30 AM |
| ron22 255 posts msg #154661 - Ignore ron22 |
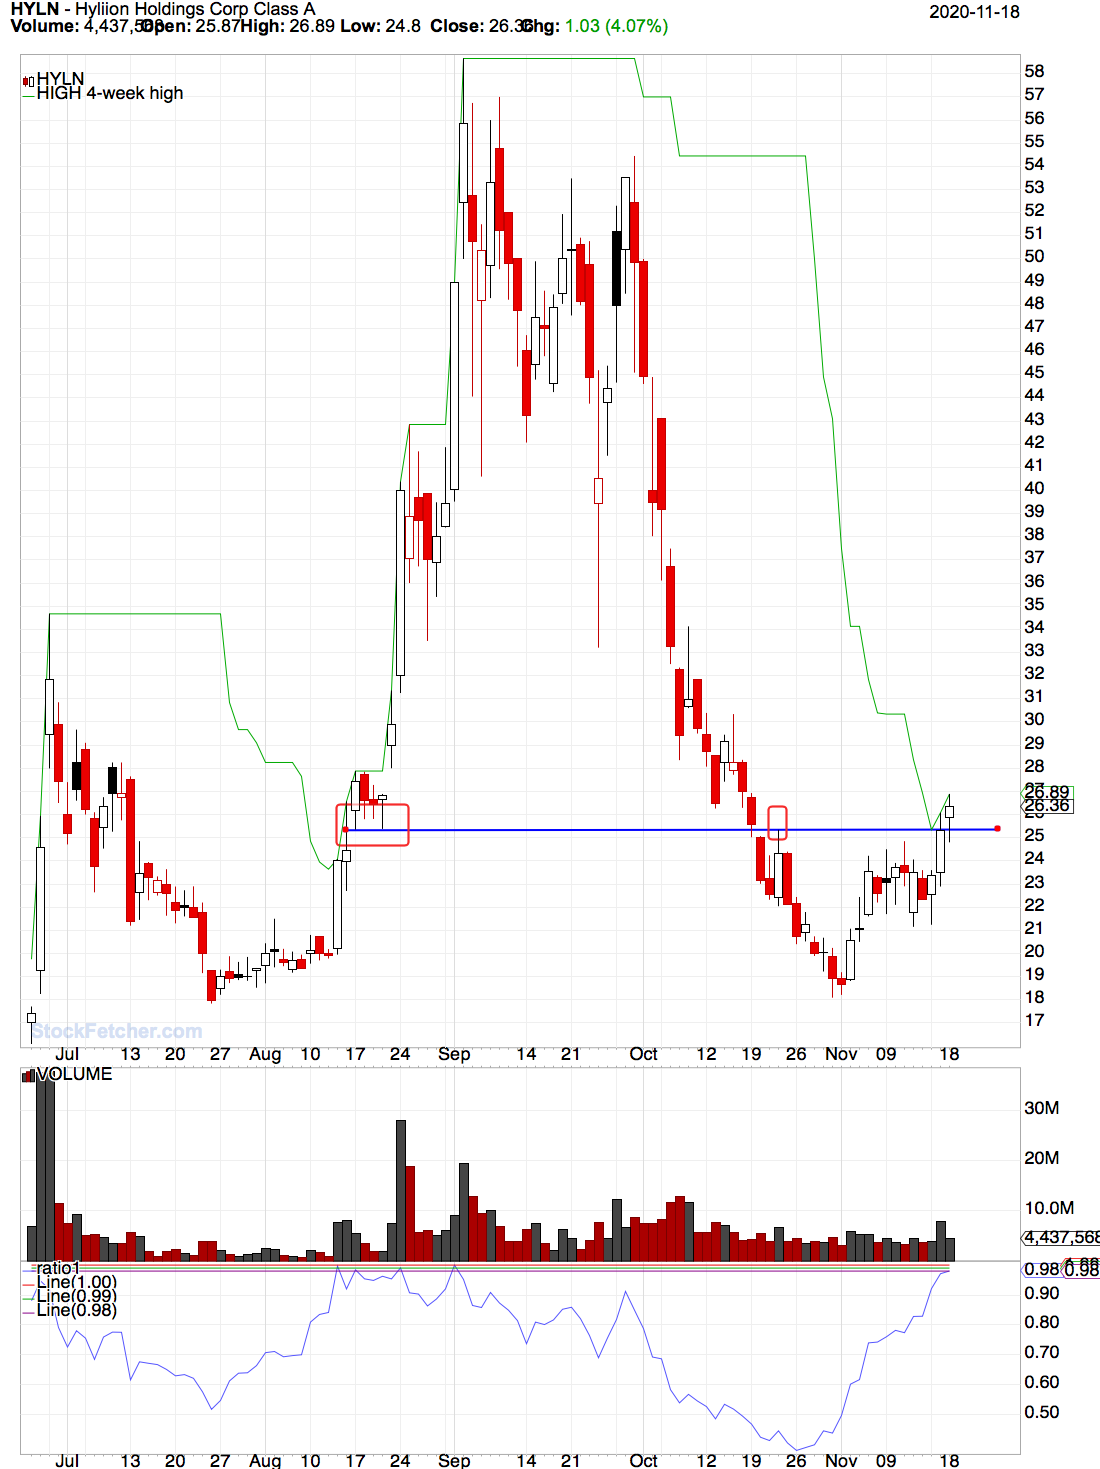
11/18/2020 12:07:10 PM Mac, the video is very good. Thank you. Mac & Cheese, thank you both for the filter which looks promising. Mac, You obviously did not use Cheese's symlist when you found HYLN. Did you review hundreds of charts to find HYLN or did you reduce the potential selections via price, volume, particular market, or your own personal watchlist? I am just trying to figure out the best way to trade this filter. Thanks a lot. |
| Mactheriverrat 3,178 posts msg #154662 - Ignore Mactheriverrat modified |
11/18/2020 1:51:02 PM using the below code ---------------- Draw high 4 week high set{ratio1, price / above high 4 week high } and add column ratio1 and add column ratio1 one day ago draw ratio1 line at 1.00 draw ratio1 line at 0.99 draw draw ratio1 line at 0.98 sort column from 1.00 downwards. See where price is setting up to breakout of high 4 week high. look for previous resistance area's and draw a trend line. breakout out happens when price close's above previous resistance levels. Make sure you have a stop loss sell order so you don't get taken to the cleaners in a false breakout. If a breakout then move you stops as you need them. ------------------------ My filter RSI(12) above 45.00 market is not otcbb market is not etf price is below 30 price is above 0.01 Volume above 400000 ------------------------- sort column from 1.00 downwards every day. Make a watch list and keep you near breakout on it. Draw previous resistance trend line and you will start to see more and more breakouts as the happen just like in the video. To me people seem to think you need some type of Holy Grail Indicator. One thing is for sure. Everyone from Warren Buffet's traders to the newest trader see's price action and volume. |
| Mactheriverrat 3,178 posts msg #154663 - Ignore Mactheriverrat |
11/18/2020 1:53:44 PM |
| ron22 255 posts msg #154666 - Ignore ron22 |
11/18/2020 5:38:53 PM @Mac, Thank you very much for your detailed explanation. This gives me a clear plan regarding how to use this filter. Good Trading. Ron |
| StockFetcher Forums · General Discussion · Breakout Trading Webinar (Kunal Desai) - owner of BullsonWallstreet. | << 1 2 3 4 >>Post Follow-up |