| StockFetcher Forums · Filter Exchange · Alpha Filter based on Ron Groenke Visions V | << 1 2 3 4 5 ... 9 >>Post Follow-up |
| dtatu 143 posts msg #146509 - Ignore dtatu |
2/10/2019 11:30:36 AM set{bla, high 10 day high - low 10 day low} set{blb, bla * .25} set{bl, low 10 day low + blb} set{bra, bl - close} set{brb, bra / blb} set{br, 10 * brb} set{taa, ma(10) * 2} set{tab, taa - close} set{tac, ma(10) / tab } set{tad, tac + 1} set{tai, br * tad} set{pointb1, bla * .125} set{pointb, bl + pointb1} set{pointc, low 10 day low + pointb1} draw ma(20) draw ema(9) draw ma(50) draw bl on plot price add column separator add column tai add column bl add column separator set{gr, count(tai above 10,1)} set{ta, count(tai between -5 and 10,1)} set{wait, count(tai between -10 and -4.9,1)} set{bad_idea, count(tai below -10,1)} set{alpha_start, count(tai below -50,1)} set{alpha_end, count(tai crossed above -30,1)} add column gr{get_ready} add column separator add column ta{take_action} add column MACD Histogram(12,26,9) add column 2 day slope of MACD Histogram(12,26,9) add column separator add column wait add column bad_idea add column separator add column alpha_start add column alpha_end add column separator draw tai line at -50 draw tai line at -10 draw tai line at -5 draw tai line at -31 draw alpha_start draw alpha_end draw Slow Stochastics Fast %K(5,5) draw Slow Stochastics Fast %K(12,3,3) draw ta chart-length is 6 months symlist(spy,dia,qqq,sds,vxxb,iwm) Sort column 11 descending |
| dtatu 143 posts msg #146510 - Ignore dtatu modified |
2/10/2019 11:36:35 AM I don't know how to post a filter , nor am I a a decent programmer; As I am looking a lot for short signals, in order to play diagonal weekly puts,I 'd like to have a confirmation linked to "Take Action": I added an MACD Hist column( to be negative) and another MACD histo column with a 2 day slope. Ideally, I think , It would this combination: Take Action+ negative MACD hist+ up sloping 2 day slope MACD hist( countertrend rally)+ Alpha Start=0 + Alpha End =0 Q: is there a way to better see the Alpha direction ALL the time?(ie: keep +1 for long positions and -1 for Shorts? Thanks for your suggestions |
| Cheese 1,374 posts msg #146512 - Ignore Cheese |
2/10/2019 12:15:18 PM Thanks again, SAFeTRADE. Very kind of you. |
| nibor100 1,103 posts msg #146513 - Ignore nibor100 |
2/10/2019 12:30:08 PM @dtatu, The process of posting a filter is simple once you learn it: Assume I have a simple filter in the SF editor window such as: Close > 10 a. In order to post it I would highlight all of the text and type CTRL C (this copies it) b. then I would put my cursor at the place in my new post that I want to see it and type CTRL V (this pastes it) Note: that some of the following instructions will appear blue in my final post. c. then I would type (Note that SF puts everything between those 2 "commands" in blue whether they are really filters or not) d. then I would select the Preview Message box below the Post editing window and see if the filter text turns blue and shows SF results info . e. If everything looks OK then select the Post Message box if not select the Continue Editing box and clean stuff up. f. See finished example below: Hope this helps, Ed S. |
| SAFeTRADE 661 posts msg #146514 - Ignore SAFeTRADE |
2/10/2019 5:09:29 PM This the Visions V original indicator using Ron's 52 week high and 52 week low numbers. I also found a math error and corrected that. Ron likes to see Price trading above the MA(50) before buying. Should Price trade above BL(Buy Limit) and is below MA(50) the stock comes off of the watch list. |
| Cheese 1,374 posts msg #146515 - Ignore Cheese |
2/10/2019 10:09:41 PM Thanks again, SAFeTRADE. Much appreciated. |
| SAFeTRADE 661 posts msg #146522 - Ignore SAFeTRADE |
2/11/2019 1:05:27 PM Here was the Visions V for Ge. 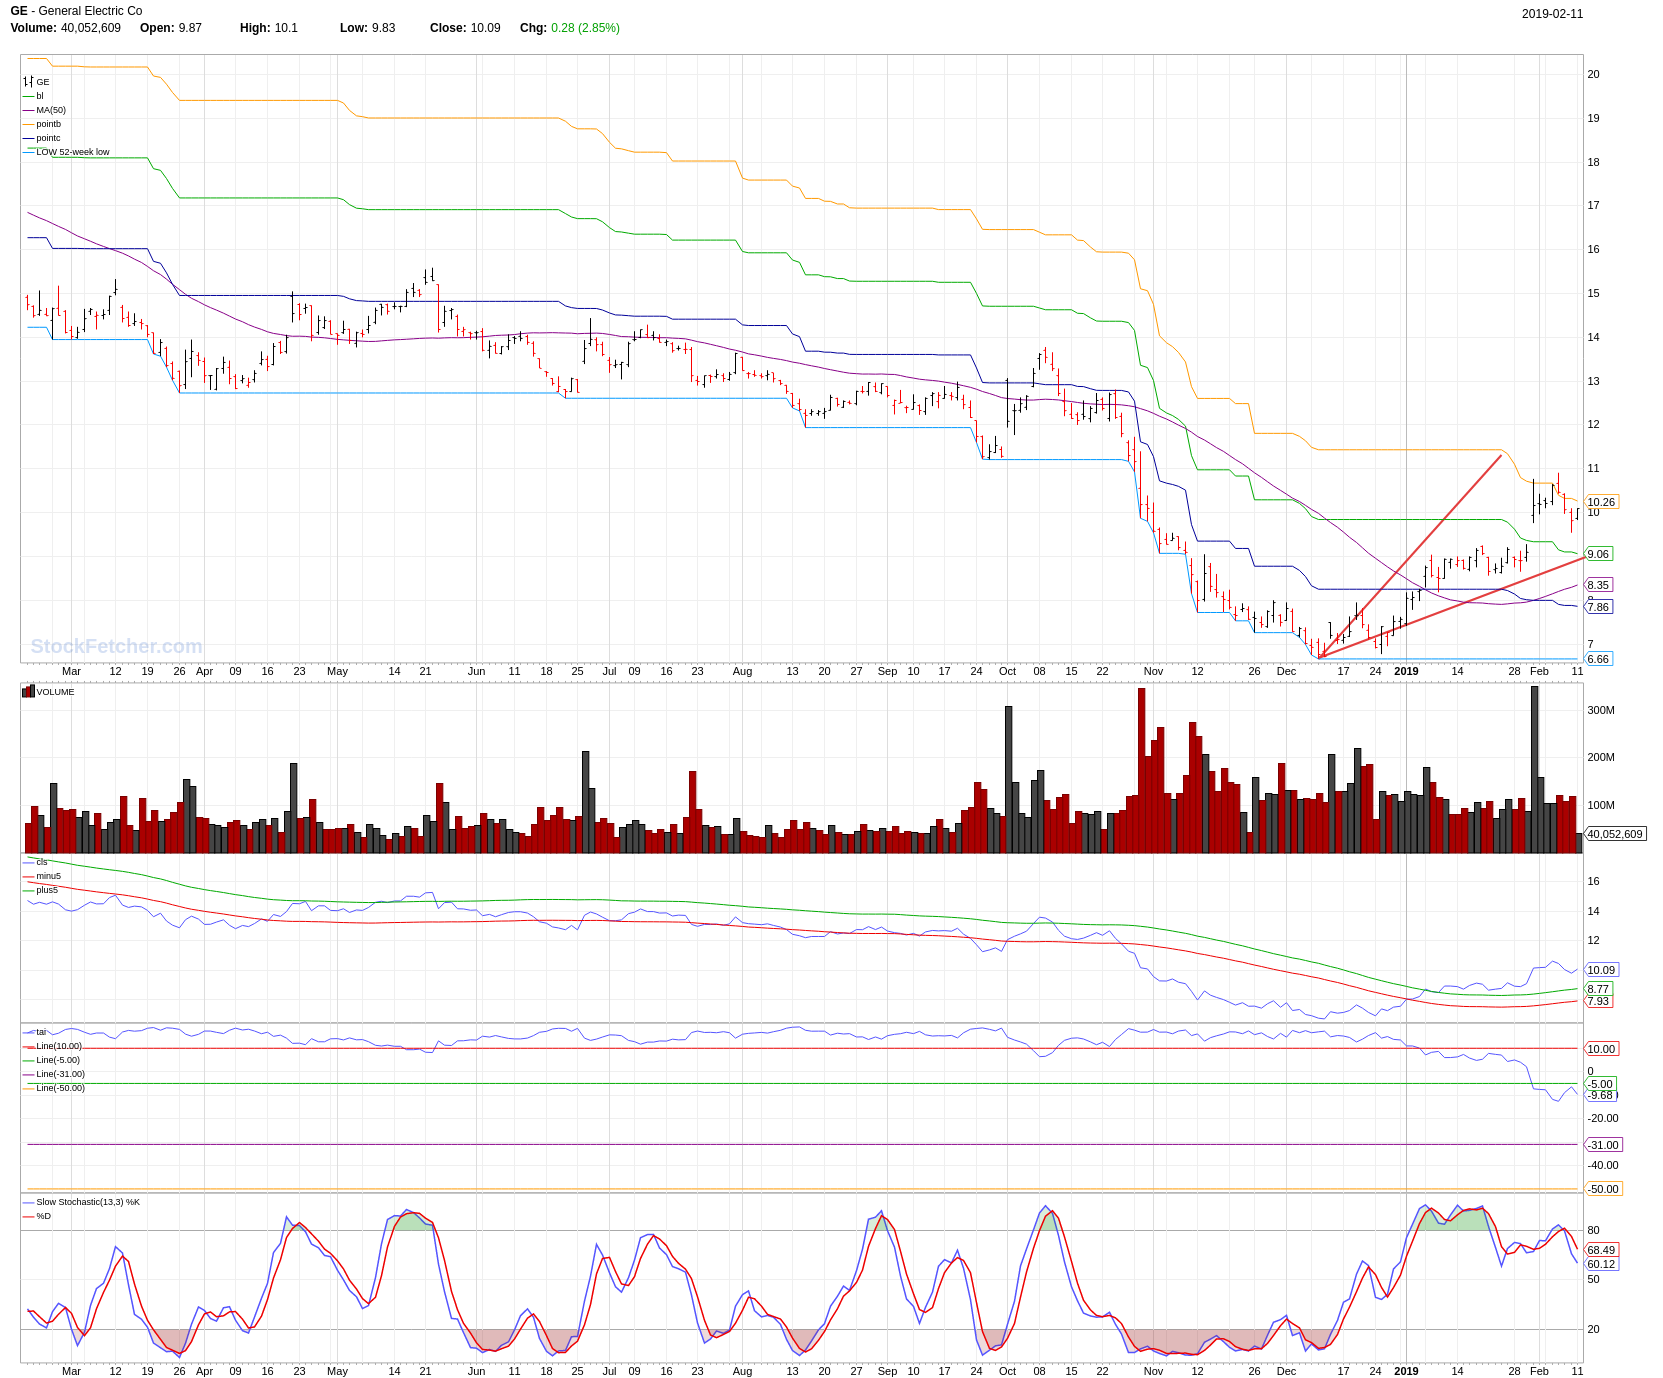 |
| SAFeTRADE 661 posts msg #146525 - Ignore SAFeTRADE |
2/11/2019 1:50:15 PM Here is one might be a good choice. 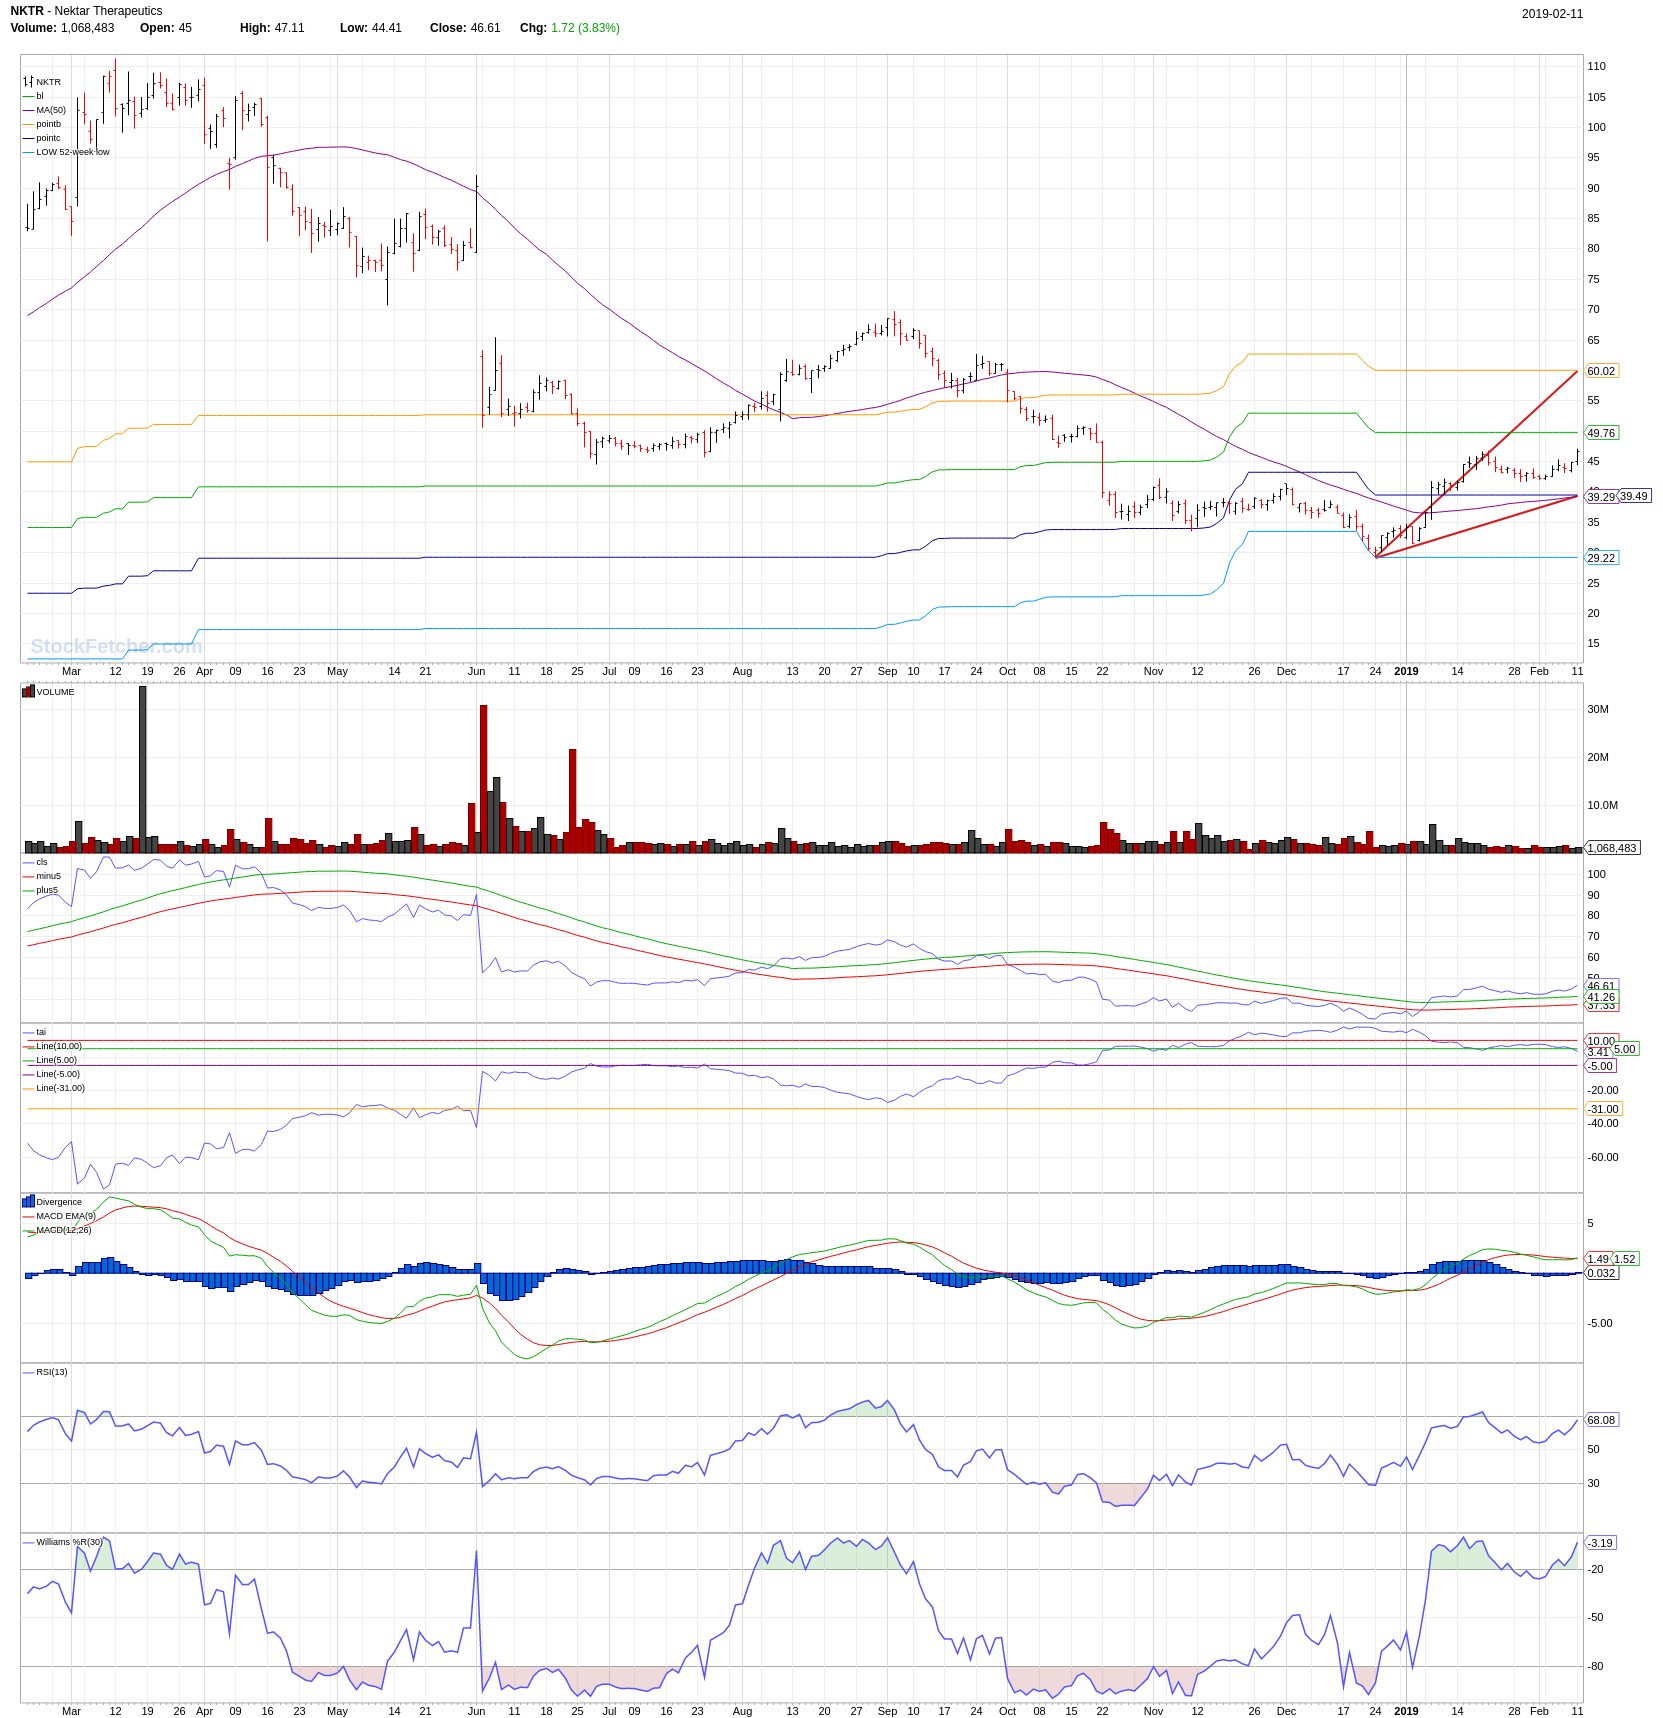 Think I am going to paper trade this one, see how it goes. |
| Cheese 1,374 posts msg #146526 - Ignore Cheese |
2/11/2019 2:13:02 PM Thank you very much, SAFeTRADE. It's clearer now, |
| snappyfrog 753 posts msg #146528 - Ignore snappyfrog |
2/11/2019 6:34:59 PM I may have missed it in the code, but what is the "v" angle calculation? Is it the same degrees or does it vary? TIA |
| StockFetcher Forums · Filter Exchange · Alpha Filter based on Ron Groenke Visions V | << 1 2 3 4 5 ... 9 >>Post Follow-up |