| StockFetcher Forums · Stock Picks and Trading · Picks and Pans Since Jan 2020 | << 1 ... 9 10 11 12 13 ... 29 >>Post Follow-up |
| sandjco 648 posts msg #151404 - Ignore sandjco |
3/24/2020 8:23:52 AM Xarlor, thank you x2!!!!! Grateful for your help as always! For the low reference...SPY's 3 yr low is 218 and 5 yr low is 181 assuming I didn't mess up this formula that i derived from Xarlor: For the volume thing...I'm just in the early stages of trying to understand the correlation between price and volume as I've often wondered if trading could be as "pure" as just looking at price and volume without using anything else. Why? Fascinated by the psychology of the "buy" and "sell" decisions and given today's pandemic heavy headlines, I am able to witness it first hand. In the elevator about 2 weeks ago, an advisor was talking his client out of liquidating and to stay put...I also find myself tempted to "act" expecting this and expecting that. So far, patience has prevailed. So far, the temptation of trying to "catch the bottom" has been avoided. Lots of damage in a month; WMA150 (Weinstein reference point?) barely budged... 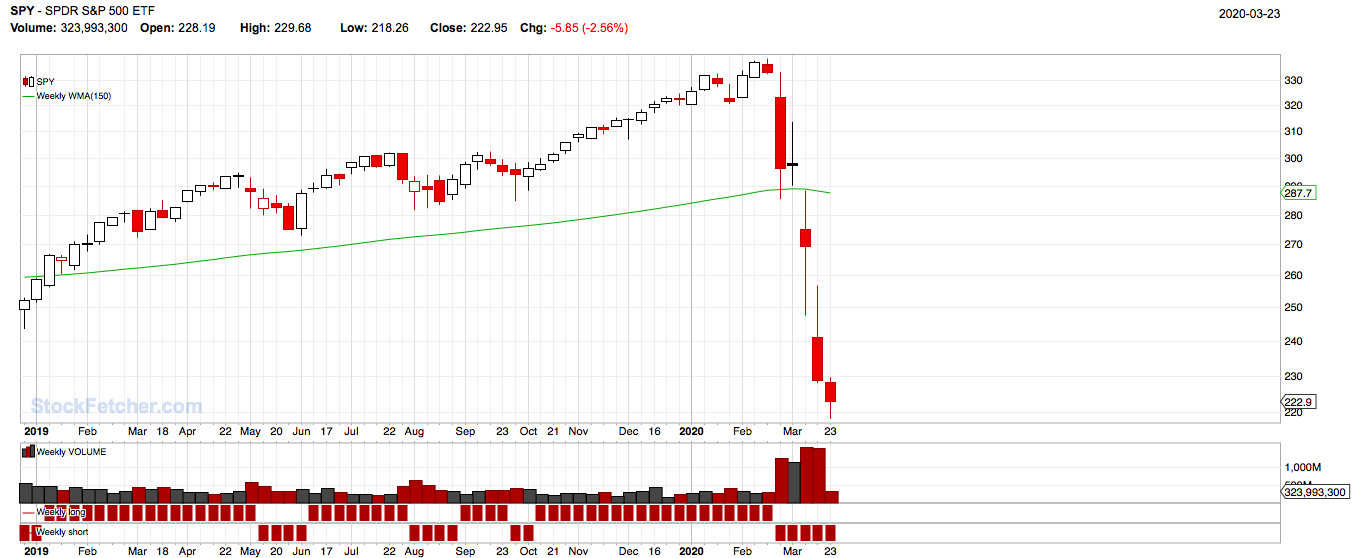 Stay safe! |
| sandjco 648 posts msg #151405 - Ignore sandjco modified |
3/24/2020 8:52:46 AM Based on Xarlor's formula... gotta run.. - have to find the highest monthly volume over 'x' time - draw the volm1 and 2 on vol pane |
| sandjco 648 posts msg #151437 - Ignore sandjco |
3/25/2020 8:25:56 AM Is this the turn? stop at $16 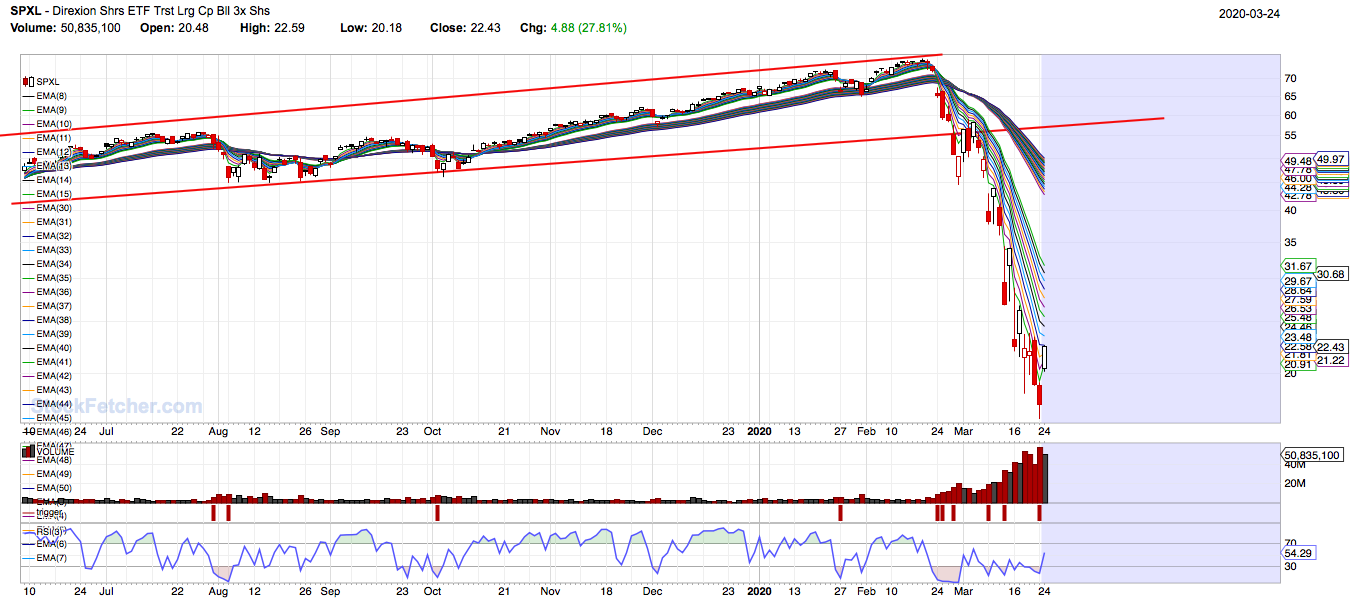 |
| sandjco 648 posts msg #151459 - Ignore sandjco |
3/25/2020 11:07:10 PM 2 Trillion bailout package stuck ...SPOO faded  Meanwhile US is now 206 cases/1M pop vs China's 56/1M |
| sandjco 648 posts msg #151548 - Ignore sandjco |
3/29/2020 5:46:22 PM When is the other shoe supposed to drop? DOW 3 mo -24% SPY 3 mo -21% QQQ 3 mo -13% 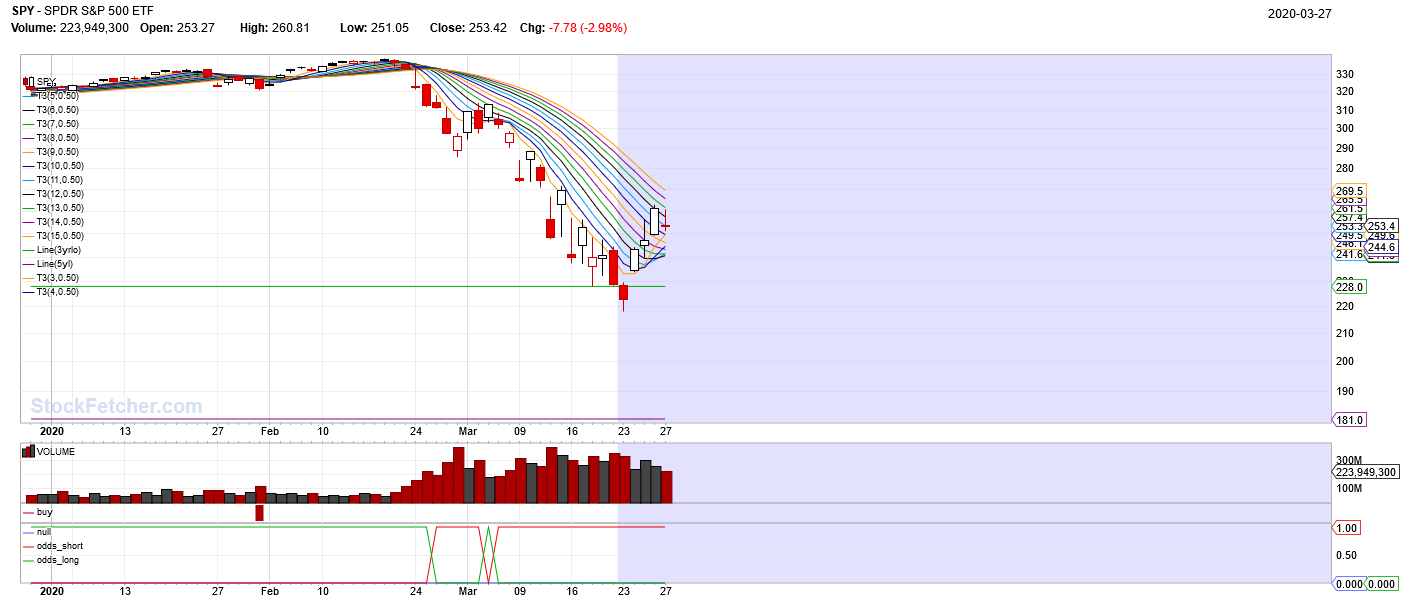 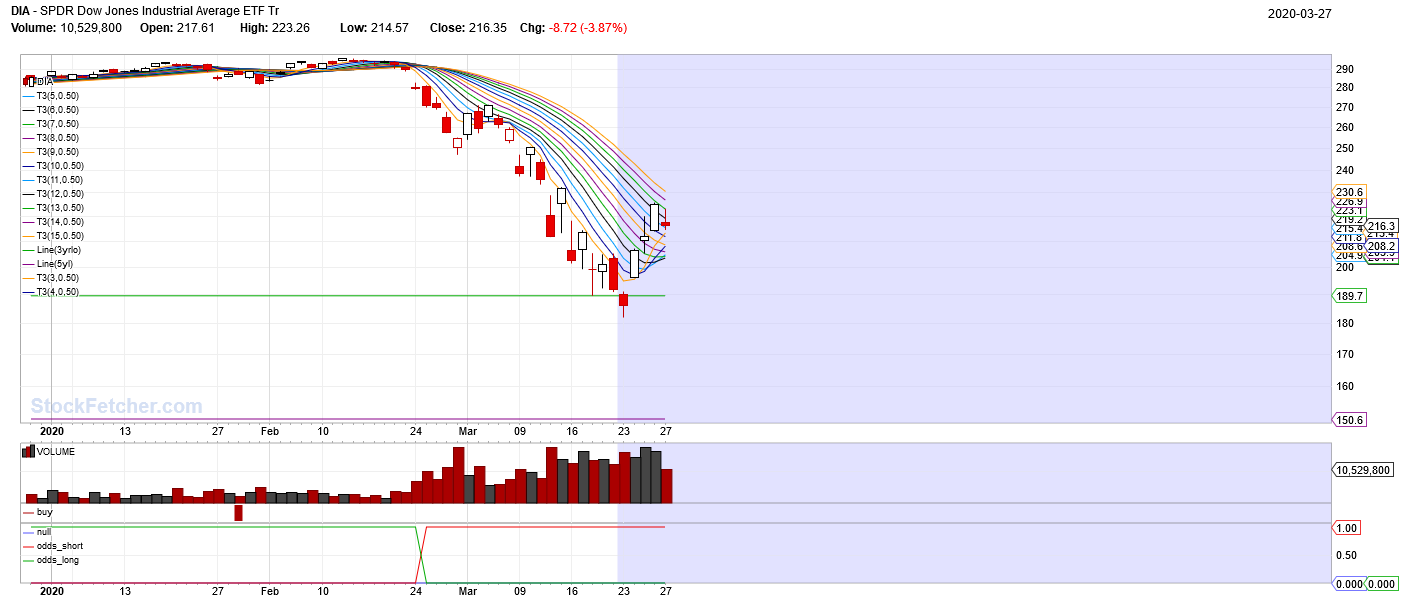 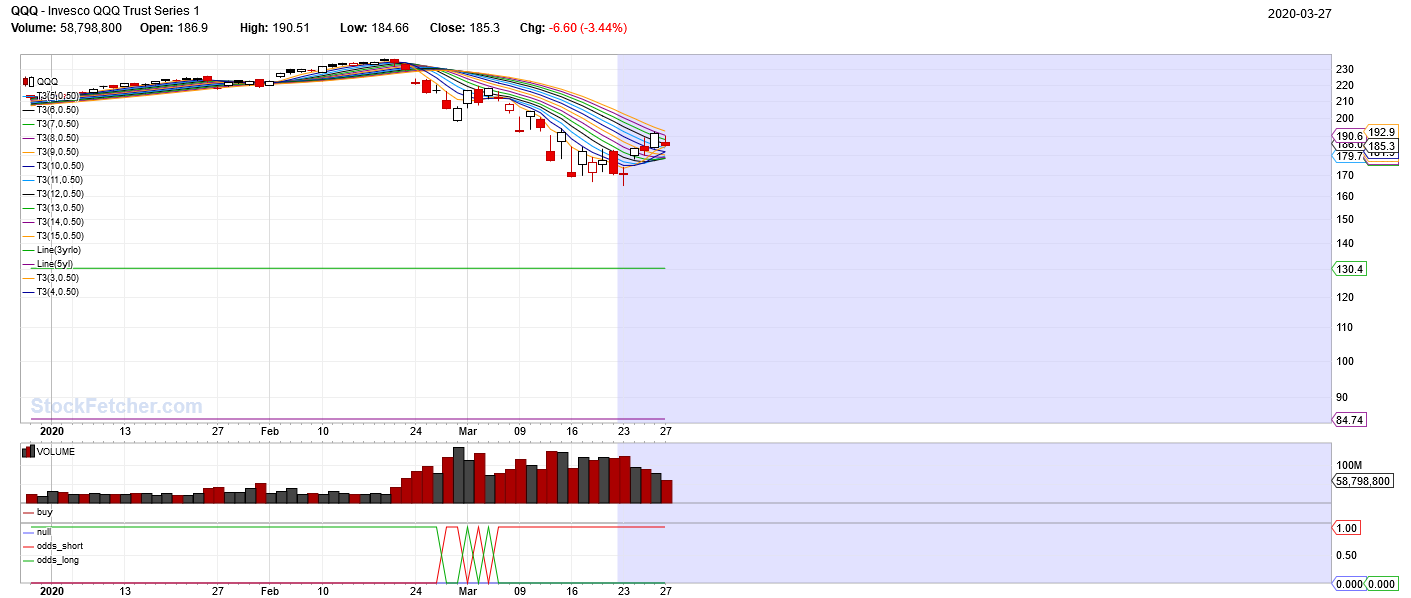 FXI dropped 33% from approx $44 high.. Interesting ... the supposed to be more "risky" and volatile Tech type index hasn't "crashed and burned" (hit 3 yr low?) as bad as the "conservative" type? News? What else...dominated by Corona still with US now surpassing China at 121K vs 81K and 718K worldwide. With 533K active cases and 6% or 26K deemed critical. Social distancing is the buzzword with non essential services closed forcing gov'ts to pump liquidity into the system not only by lowering rates but also in "aid$$". $$ to buy time to flatten the curve? |
| sandjco 648 posts msg #151582 - Ignore sandjco modified |
3/31/2020 8:57:35 AM Eye catching headlines are now popping up... - Another "massive decline" is around the corner - Things will be worse than the "great depression" While I wasn't born during the depression....I know they didn't have Tinder them days nor did they have any gene sequencing technology nor was the QE the thing. The way I look at it, once we flatten (like China did), we will soon realize that it wasn't the end of the world. Maybe a month or two more of meandering? Meanwhile, there are now 800,000 cases worldwide; 591K are active and of those 30K are serious. US has twice more cases than China at 164K. NY is getting the brunt of it. So easy to get sucked into the headlines. Per my previous post...if this was really bad, we should have fallen harder no? TTWO has no business staying this healthy bruh. Looks like the bear was selective in who it was going to thrash. Nothing wrong to nibble around for B&H   What business does this have in getting high?  Guppy view..next levels to hurdle 270 and 285. Looks like the traders are back. 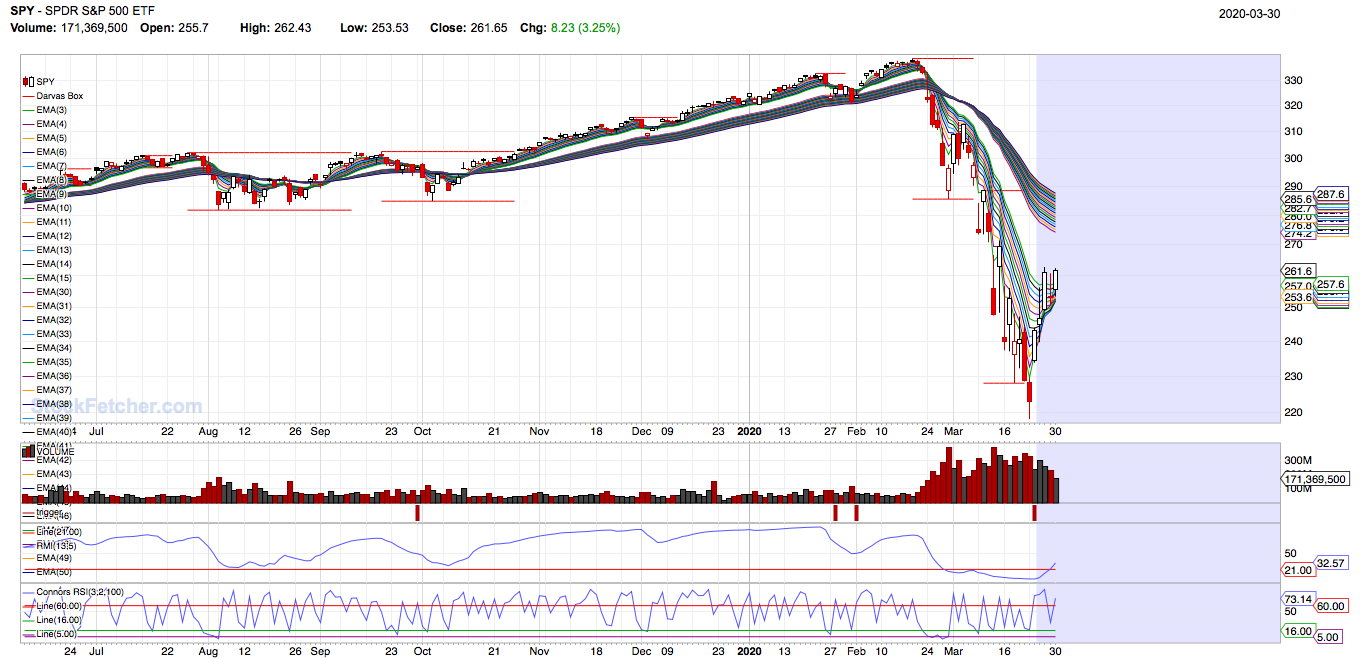 stay safe out there! |
| sandjco 648 posts msg #151614 - Ignore sandjco |
4/1/2020 8:17:43 AM Using Mar 23 SPY low as a reference point 1st case reported on Jan 10th (China and the 20th US and 29/10 for Spain and Italy). China peaked on Feb 12th close to 15K cases/day. US now close to 25K/day. China's approach was/is pretty much Orwellian (Big data, tracking, lockdown, et al). We have the capability but highly unlikely it would be used here. So...how will this story pan out? QQQs are a resilient bunch...propped up by GOOG, NFLX, AMZN? Interesting AAPL didn't fall further given their exposure to retail/supply chain in Asia...the more i think i know...the more i really don't know! 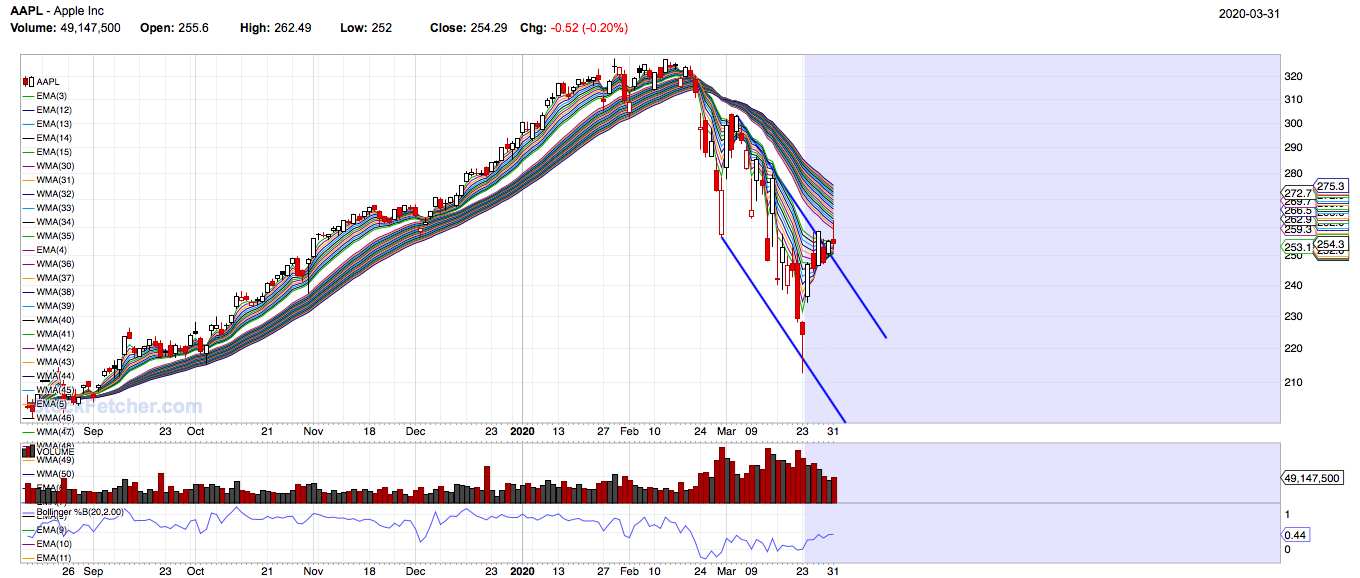 assuming i didn't mess up the code... |
| sandjco 648 posts msg #151732 - Ignore sandjco modified |
4/5/2020 11:20:12 AM The 1918 Spanish flu infected about 28% of US's 100M+ population with a 0.6 approx death rate. Higher mortality rates with those under 60; opposite of the Corona virus. The 2009 Swine flu (H1N1) that apparently originated in Mexico affected 6.7MM globally and a vaccine was found in 8 months (we declare a state of public health emergency in Apr). https://en.wikipedia.org/wiki/2009_swine_flu_pandemic_timeline SPY on Mar 2008 was 131.97; on Jan 2009 it was 90.44. 45% haircut. Didn't see 131 again till Mar 2011 SPY on Jan 2009 was 90.44; on Mar 2009 was as low as 63.26. Another 40% haircut. Digging further...Sep 2008 was the tipping point of the Financial crisis (2007 start). Oct 2008 SPY was 115.27 with a low of 76.41 and traded 11.8B shares compared to Jan 2020 SPY was 323.54 to a low of 218.26 (48% drop) on Mar 2020 with highest monthly vol of 5.92B shares in Mar. Maybe I was too young but I do not remember anything memorable about the H1N1. No doubt social media has been responsible for the heightened awareness of CV19. WHO estimates up to 500k die from seasonal flu annually (66K from CV19 so far and 16K from Swine flu) Given our current 300M+ pop and advances in science, how will this translate? The 2009 H1N1 (not minimizing it) was probably drowned (given lower mortality rate) by the bigger drama of the Financial crisis. The crisis was triggered by Ninja mortgages given to people who normally wouldn't be able to qualify. This shouldn't really be an issue now right? The current concern...how long will this social distancing last? How long will companies continue to pay employees to work remotely if they continue to see revenues drop (e.g. Airlines who have now laid staff off?). Will lenders implode ala financial crisis? Lenders can usually offer deferred payments. Unless these borrowers lose their jobs...lenders don't have much to worry. So much uncertainty...Cash is boring and tests your patience but you learn to appreciate it. IWM Jan 104C for $13. 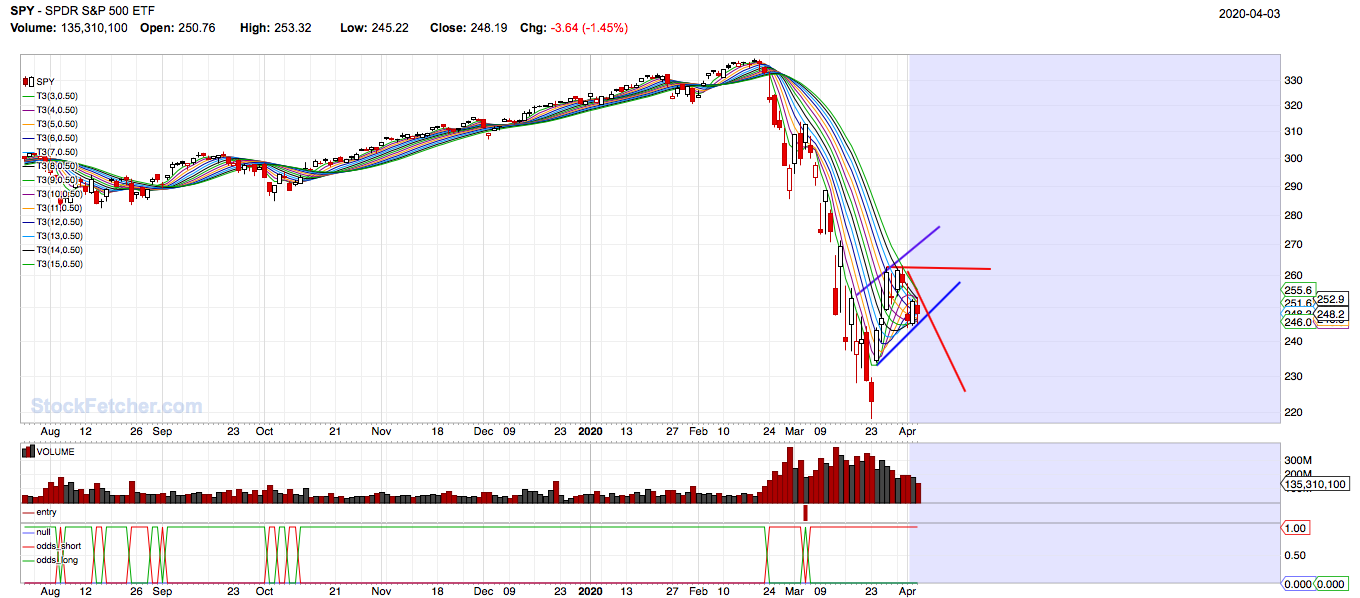 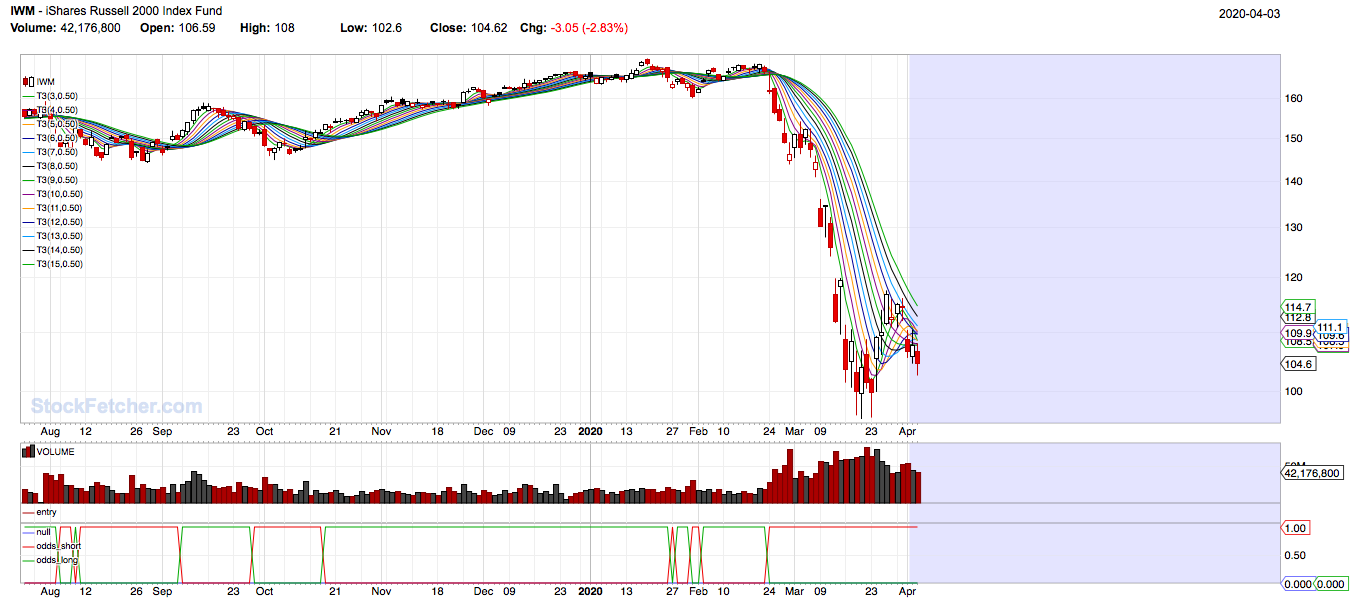 |
| sandjco 648 posts msg #151756 - Ignore sandjco |
4/6/2020 9:50:47 AM Minerd, Chief Inv Officer at Gugenheim sees SPY dropping to 1500 https://ca.finance.yahoo.com/news/bold-market-calls-abound-minerd-090756647.html Dimon, CEO JPM sees 2008 like downturn aka bad recession https://ca.finance.yahoo.com/news/jamie-dimon-sees-bad-recession-111145837.html Funny how these jokers come out AFTER the party has already started. Buffet, meanwhile, raises $4B in yen dominated 40 yr bonds https://ca.finance.yahoo.com/news/berkshire-hathaway-join-global-debt-071735947.html |
| sandjco 648 posts msg #151759 - Ignore sandjco |
4/6/2020 12:32:51 PM Why I am interested in Psychology and group think... https://finance.yahoo.com/news/5g-virus-conspiracy-theory-fuels-083303568.html?.tsrc=rss 5G...aids in the spread of the virus. Just like the hoarding of toilet paper... When will the market reverse its current trend? Psychology (price and volume) will show it albeit like looking at your rear view mirror? Always questioning and wondering as you move forward. First time SPY broke the T3 bands 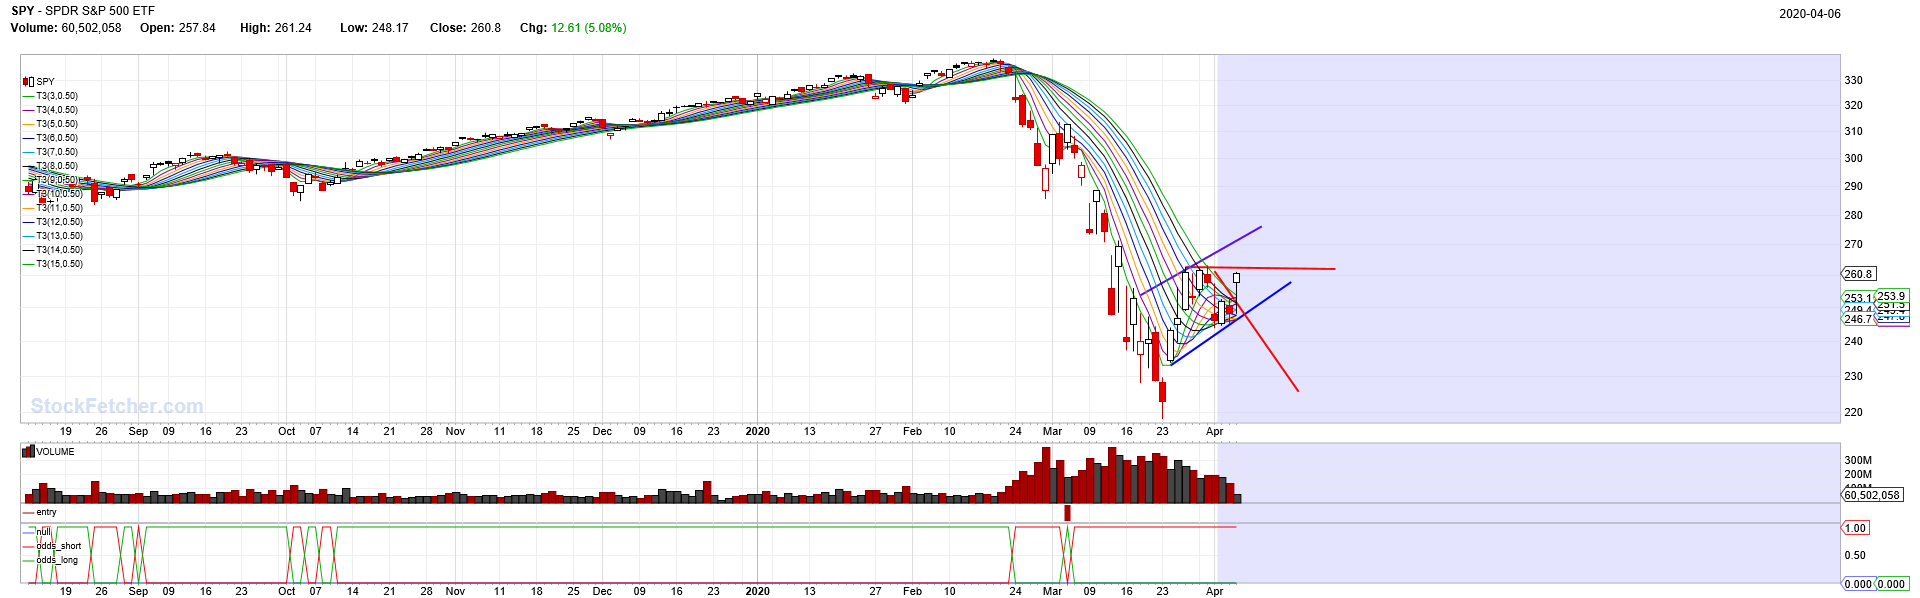 Broker thru Trader Group Guppies 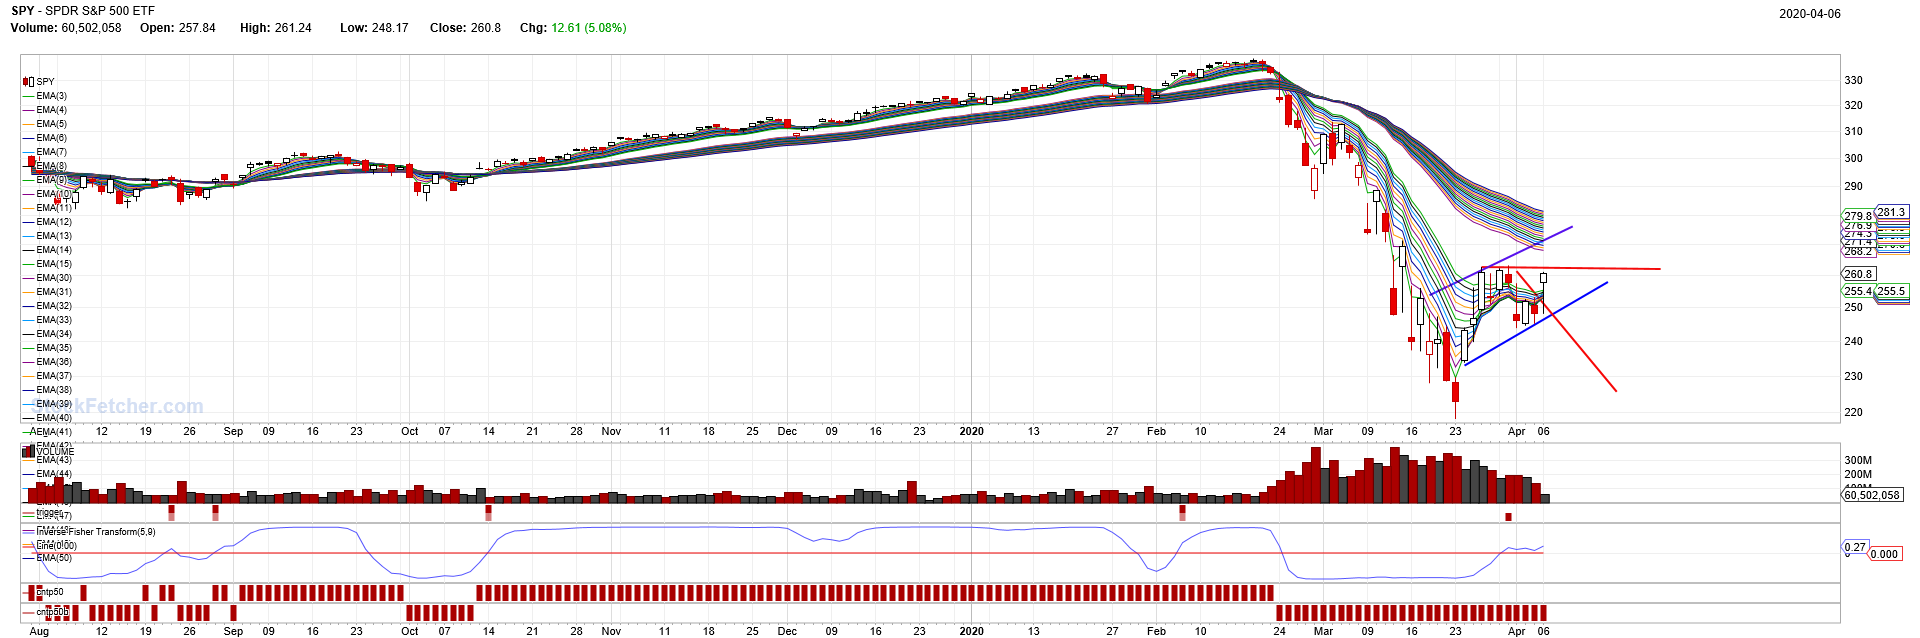 So far so good 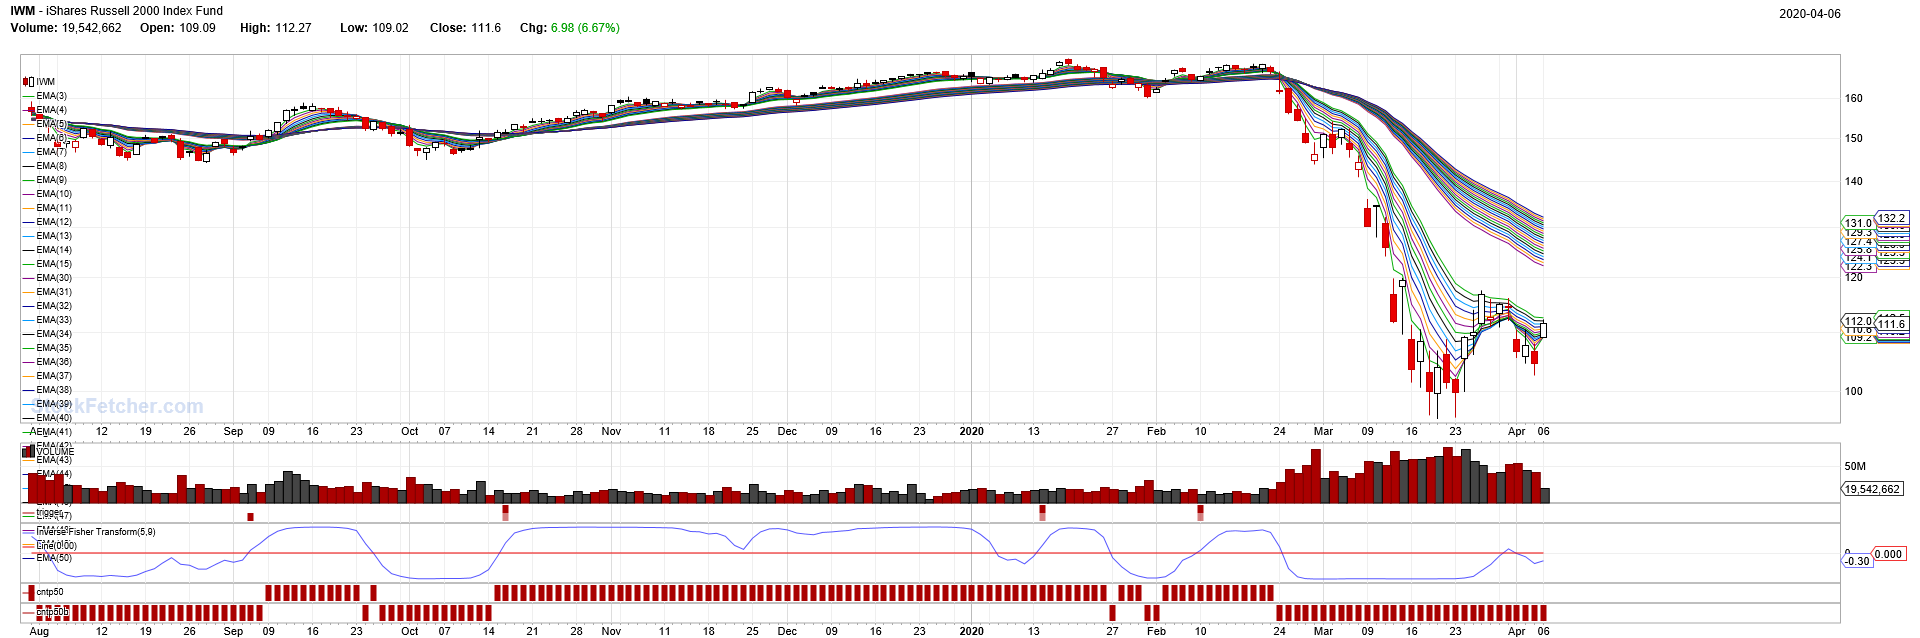 |
| StockFetcher Forums · Stock Picks and Trading · Picks and Pans Since Jan 2020 | << 1 ... 9 10 11 12 13 ... 29 >>Post Follow-up |