| StockFetcher Forums · General Discussion · Mansfield RS question | << 1 2 >>Post Follow-up |
| graftonian 1,089 posts msg #148217 - Ignore graftonian modified |
6/20/2019 6:45:07 PM If the Mansfield RS is above zero, does this infer performance above the index? Graf |
| Mactheriverrat 3,178 posts msg #148218 - Ignore Mactheriverrat |
6/20/2019 6:58:54 PM Still trying to figure all that out as some stock of past performance it was below 0 but still made a nice gain. https://www.chartmill.com/stockcharts.php?o=6445&ticker=ge&timeframe=WEEKLY&months=0&o2=&op2=&o1=5&op1=30%2C255&o3=&op3=&i1=24&ip1=52&i2=&ip2=&i3=81&ip3= https://www.chartmill.com/stockcharts.php?o=6445&ticker=endp&timeframe=WEEKLY&months=0&o2=&op2=&o1=5&op1=30%2C255&o3=&op3=&i1=24&ip1=52&i2=&ip2=&i3=81&ip3= https://www.chartmill.com/stockcharts.php?o=6445&ticker=endp&timeframe=WEEKLY&months=0&o2=&op2=&o1=5&op1=30%2C255&o3=&op3=&i1=24&ip1=52&i2=&ip2=&i3=81&ip3= |
| Mactheriverrat 3,178 posts msg #148226 - Ignore Mactheriverrat modified |
6/21/2019 11:42:42 PM To my understanding when the Mansfield RS comparison has a crossover of ma52 is a strength. Take GE being still in a stage 1 but closing is a stage 2 . 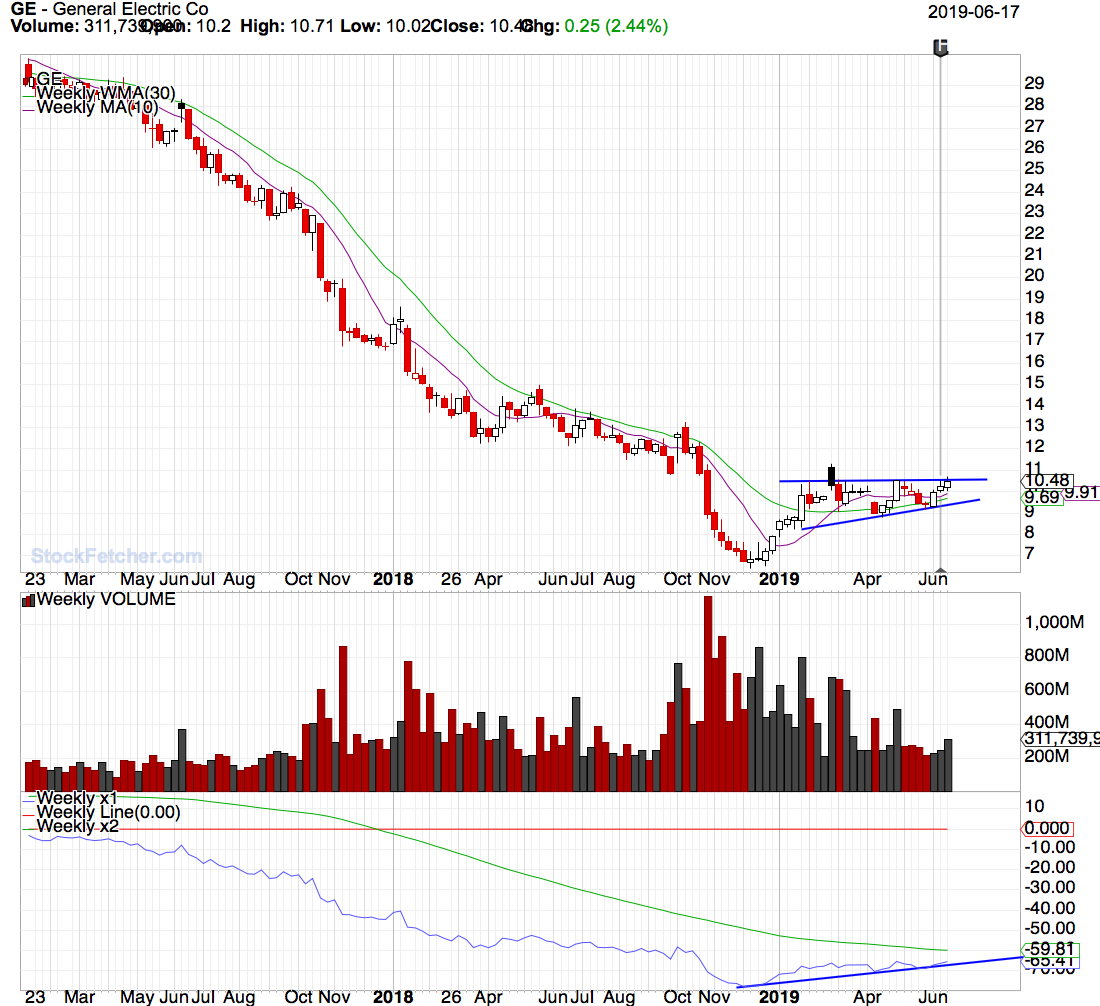 |
| Mactheriverrat 3,178 posts msg #148228 - Ignore Mactheriverrat |
6/22/2019 4:40:17 AM Definition Mansfield's Relative Strength https://www.centralcharts.com/en/gm/1-learn/7-technical-analysis/26-technical-indicator/406-mansfield-s-relative-strength |
| graftonian 1,089 posts msg #148231 - Ignore graftonian |
6/22/2019 9:47:49 AM Hey Mac, did you stop at Pere Marquette State Park for their famous fried chicken? Thanks for the Mansfield info, however I have another question. I'd like your assessment of VIPS compared to GE. To me, they seem to be in about the same stage, with VIPS perhaps a little closer to Stage 2. My scripts are written in daily terms, I get seriously screwed up trying to code in the weekly time frame. |
| Mactheriverrat 3,178 posts msg #148232 - Ignore Mactheriverrat |
6/22/2019 10:25:48 AM No I haven't stop there . Next time I bring my wife to st louis we will have to come up here to try some of their chicken. Were sitting about a mile above the boat ramp . We can see the road that goes by the park. As far a GE is concerned I this it will breakout when the blue and green lines cross one another. Its the relative preformance vs the sp500 / spx. I expect it to breakout with higher volume. See the higher volumes in late last year / early this year. That tells me big buyers see the same thing that GE is waking up. 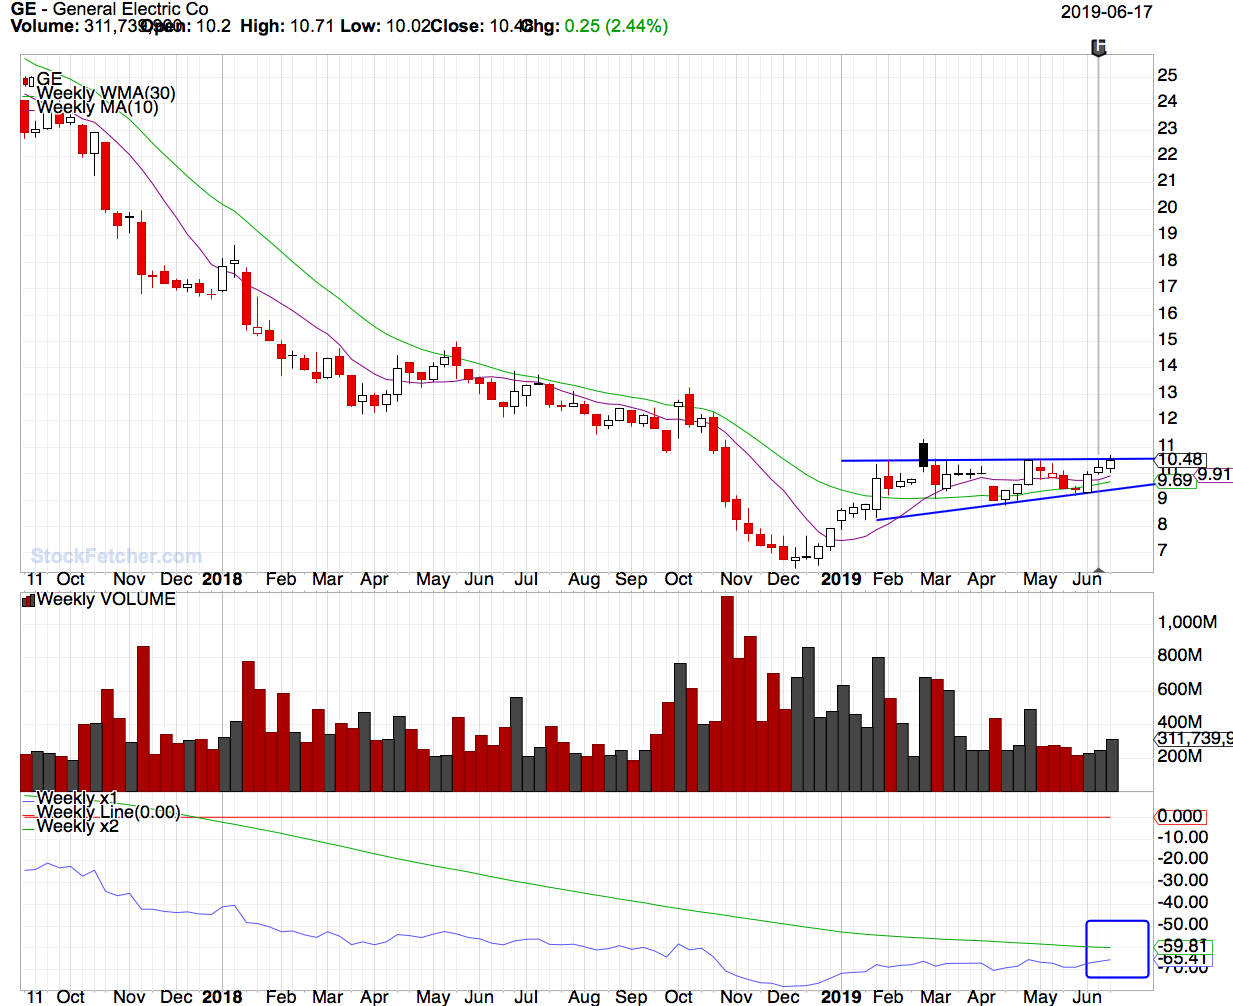 Look at message #192 on the stock PLUG and its relation https://stageanalysis.net/forum/showthread.php?tid=11&page=24&highlight=stockcharts |
| Mactheriverrat 3,178 posts msg #148233 - Ignore Mactheriverrat |
6/22/2019 10:29:18 AM BTW- Internet is piss poor up here by the park. I wish we could drop below the mouth of the Illinois River and back in by the road. Then is no free waiting areas as boats are backed up down there. Its always been poor internet service from Hardin down to the mouth of the river. |
| Mactheriverrat 3,178 posts msg #148234 - Ignore Mactheriverrat |
6/22/2019 10:44:06 AM This relative preformance vs the sp500 / spx is different to what Stan Weinstein shows in his book. I've also seen different indicators add from some posters. Seems to have muddled up the true system from Stan Weinstein. Guess I will have to pick through extra's and keep it clean of a system . Seems the relative preformance vs the sp500 / spx crossing is a great key . As I have been looking at past winners for the last 3 months to a year. Stockchart.com has a good relative preformance vs the sp500 / spx setup but you have to buy into it. Guess I'll do that we I get home in about 2 1/2 weeks. Chartmill has some free Mansfield indicators until one runs out of free credits https://www.chartmill.com/stockcharts.php?o=6445&ticker=ge&timeframe=WEEKLY&months=0&o2=&op2=&o1=5&op1=30%2C255&o3=&op3=&i1=24&ip1=52&i2=&ip2=&i3=81&ip3= Bottom line is I think Stan Weinstein is a great weekly system . I'm still messing with the MA30, EMA30 or WMA30. Seen people using one or the others. I guess one is as good as the other. Guppy was great but daily charts whipsawed too much. |
| Mactheriverrat 3,178 posts msg #148235 - Ignore Mactheriverrat |
6/22/2019 10:48:20 AM Thanks to KSK8's code is more or less relative preformance vs the sp500 / spx. set{x1, compare with ^SPX} draw x1 line at 0 set{x2, cma(x1,52)} draw x2 on plot x1 |
| pa247 143 posts msg #148239 - Ignore pa247 |
6/22/2019 4:33:38 PM i have a chartmill sub and here is the GE chart with Twiggs Money Flow, which is falling off right now, but on low volume. https://www.chartmill.com/stockcharts.php?ticker=ge&o=89887&o3=&op3=&type=CANDLES&months=0&i1=51&ip1=&o2=&op2=&i2=24&ip2=52&i3=37&ip3=21&o1=4&op1=30%2C3051519&i4=&ip4=&ia4=on&nt=&filters=&tab=0&v=3&s=2&p=0 |
| StockFetcher Forums · General Discussion · Mansfield RS question | << 1 2 >>Post Follow-up |