| StockFetcher Forums · Filter Exchange · Uptrend filters | << 1 2 >>Post Follow-up |
| LewisTherin 3 posts msg #138124 - Ignore LewisTherin |
9/12/2017 1:14:52 PM Hi, I am a noob here. I was trying to make a filter which tells me when an uptrend has started. How do I write a trendline break in code here? Any other ideas would be helpful. Thanks. |
| snappyfrog 753 posts msg #138125 - Ignore snappyfrog |
9/12/2017 1:29:50 PM Maybe try this one: http://www.stockfetcher.com/forums2/Filter-Exchange/TREND-ENDER/38739/-1/38739 |
| dwiggains 451 posts msg #138137 - Ignore dwiggains |
9/13/2017 9:36:33 AM many others |
| LewisTherin 3 posts msg #138141 - Ignore LewisTherin |
9/13/2017 11:11:28 AM Hey, thanks for the help. These filters look good. The problem I am facing while trading and I have just started is most of the stocks I identify as good have already rallied and are nearing their trendline break. My idea is trying to identify the stocks for which the downtrend just broke. By just broke I mean they have just started rallying. Any advices would be helpful. |
| Mactheriverrat 3,178 posts msg #138142 - Ignore Mactheriverrat |
9/13/2017 11:43:53 AM May I suggest use of trend lines. Look at the tops of candles and where you see a change from down to up. 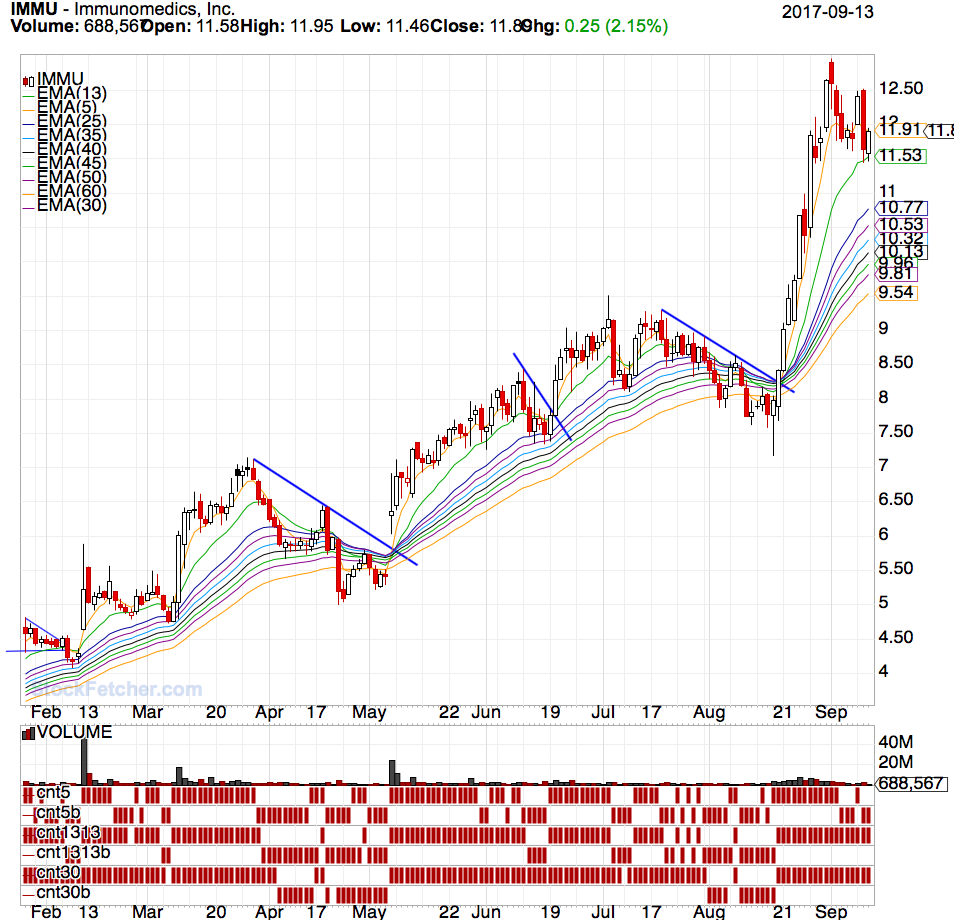 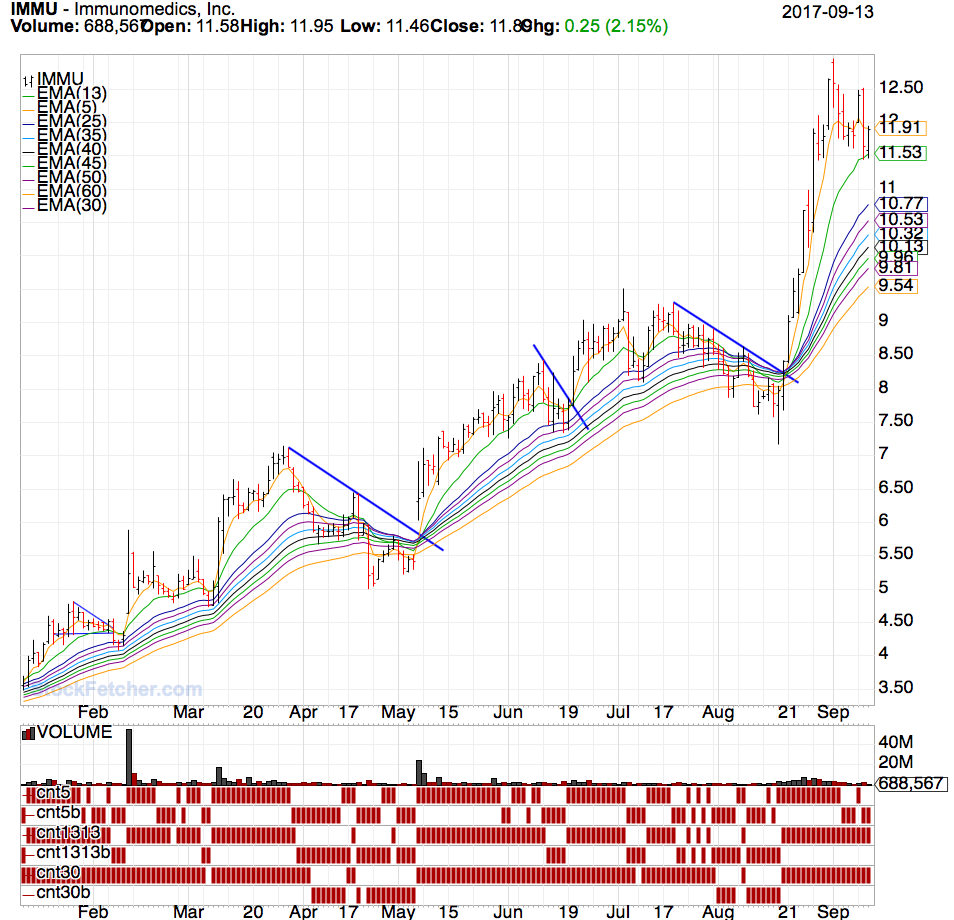 In a lot of case's its a remount of price rise above the EMA(13) or EMA(5) |
| fortyfour 189 posts msg #138209 - Ignore fortyfour modified |
9/17/2017 1:55:41 PM You don't have to get all of the new trend and insist on catching the 1st break of a downtrend. Not one on the planet can. Big money does not think and act like we do. You got "all day" to see and act on trend. Get some of it. You can reverse the rainbow for shorts. When you see more of one than the other it might be trend. In general, entries are when rainbow signal starts to rise. Two guys can use this and one may do well and the other lose. It's all you GL. |
| fortyfour 189 posts msg #138234 - Ignore fortyfour modified |
9/18/2017 12:21:50 PM If you have SF advanced you can do simple math to assign weight and do the sum of weights to all these crossovers. Also, Stratasearch can find some good performance numbers optimizing these crossovers. I found it better to do "good" fitting for "things" on an individual basis. What happened to Stratasearch and the issue of Yahoo end of day data? |
| fortyfour 189 posts msg #138271 - Ignore fortyfour modified |
9/19/2017 3:14:12 PM Have you seen that Stratasearch V4.5 is available for free download? I discovered this today and did just that. (Says limited time so.......) I have read that the free Yahoo data is no longer available and my simple query ( old method) Indeed does not work. Anyone have a method to get eod data from yahoo? i am thinking to test this trend following filter/method posted above in Stratasearch using Imported Yahoo data. Thanks. |
| miketranz 981 posts msg #138295 - Ignore miketranz modified |
9/20/2017 9:03:51 PM add column industry add column dividend yield This is what an uptrend is suppose to look like.Jump on board.... |
| SFMc01 358 posts msg #138409 - Ignore SFMc01 |
9/27/2017 12:24:58 PM miketranz: Respectfully, my question is did you use any type of filter to find "chuba?" If so would you share it, please? Steve Mc |
| StockFetcher Forums · Filter Exchange · Uptrend filters | << 1 2 >>Post Follow-up |