| StockFetcher Forums · Filter Exchange · DEADLY COMBO | << 1 ... 17 18 19 20 21 >>Post Follow-up |
| Mansor 78 posts msg #143732 - Ignore Mansor |
6/6/2018 12:18:02 AM Just realized: AvgVol 30 days was 3M AvgVol for 90 days was 50k AvgVol for 10 days was 250k All i did was rearranging: Average Volume(30) > 250000 weekly ema(5) is above weekly ema(5) one day ago price crossed above weekly ema(13) within the past 1 days close is between 1 and 20 average volume(90) above 50000 average volume(10) above 500000 ------------- We want vol to increase as day range gets shorter & shorter New scan generated top 4 Amrh mdxg vsar ecr |
| boston 58 posts msg #143733 - Ignore boston |
6/6/2018 8:44:36 AM NOT SURE IF THIS WORKS AS I INTEND IT TO WORK - 1ST POST ON SF Replying to ------------------------------------------------------------------------------------------------------------------------------------------- 9/28/2017 11:37:55 AM risjr, i just added some logic to the filter around smoothing/consistency so hopefully you can see this as more of a swing trade filter. Ideas from other folks on here. hope this helps a little. -------------------------------------------------------------------------------------------------------------------------------------------- I added from previous pages the following filter/command: and add column average day range(10) {adr10} and add column average day range(30) {adr30} to your scanner above 2nd I lowered avgvol from 3M to 500,000 3rd close range 1-10 - I believe in buying more vol at cheaper $ After running the scan, I clicked and adr(30) with the highest % TOP 4 1- ARMH -Kiss of death based Price > bb(20) & close < open 2- DARE 3- MDXG 4- VSAR |
| Mansor 78 posts msg #143739 - Ignore Mansor |
6/6/2018 4:28:28 PM **Smashed** So below you'll find script, I called it smashed cause as a novice, I used many different scripts by users of SF community and smashed them together to get some basic clear understanding & a path to follow, I hope it will help others and if anyone can edit it further & improvise more, it'll help users, please do so. With that being said, I would like to THANK TRO for his RFR scan that allowed Mike to use, incorporate and modify RFR+ADR = Deadly. I would like to thank TRO,Muddy,& Mike of course. I would also like to THANK NIKO for his DEMA & TEMA scans, and Kevin_in_GA for his work that allowed me to set buy and sell signals & PP/R/S Another user by the name of Khurana or Agarwal posted monthly set up, or was it TRO? I don't recall, but thanks to you too. I used some basic principles that I learned for charting purposes and have added them as well. /**Smashed**/ close is between 1 and 10 average volume(90) above 100000 average volume(10) above 500000 PE is above 1 set{volcnt, count(volume above 100000, 100) } set{volzero, count(volume equal 0, 100) } set{x1, high - open} set{Long_Profit, x1/open } set{C1A, count(Long_Profit > .04 , 100)} set{C2A, count(Long_Profit > .09, 100)} set{C0010, C1A - C2A} set{D1A, count(Long_Profit > .09 , 100)} set{D2A, count(Long_Profit > .19, 100)} set{D1020, D1A - D2A} set{E1A, count(Long_Profit > .19 , 100)} set{E2A, count(Long_Profit > .29, 100)} set{E2030, E1A - E2A} set{F1A, count(Long_Profit > .29 , 100)} set{F2A, count(Long_Profit > .39, 100)} set{F3040, F1A - F2A} set{G1A, count(Long_Profit > .39 , 100)} and add column daychg2 and add column C0010 {4_9} and add column D1020 {10_19} and add column E2030 {20_29} and add column F3040 {30_39} and add column G1A {40+} and add column C1A {ttl} and add column separator add column industry add column sector and add column separator draw WAIT draw SELL draw BUY draw ema(3) draw dma(25,-5) draw ma(10) draw ema(30) add column BUY add column SELL add column WAIT add column both{D2/T3} add column both2{TSI6} ADD COLUMN XOVER ADD COLUMN CROSS set{OVER, count(TSI(6,3,3) crossed above 0,1) *1} set{UNDER, count(TSI(6,3,3) crossed below 0,1) * -1} set{both2, OVER + UNDER} set{CROSS, 1 - count(both2 equals 0,1)} CROSS above 0 set{var1, 2 * EMA(9)} set{var2, cema(ema(9),9)} set{DEMA, var1 - var2} set{TEMA, T3(7,1)} set{xUP, count(DEMA crossed above TEMA,1) *1} set{xDOWN, count(DEMA crossed below TEMA,1) * -1} set{both, xUP + xDOWN} set{xOVER, 1 - count(both equals 0,1)} draw pp_3 on plot price draw r_3 on plot price draw s_3 on plot price add column pp_3 add column r_3 add column s_3 set{pp_3, CeMA(pp,3) 1 day ago} set{r_3, CeMA(r1,3) 1 day ago} set{s_3, CeMA(s1,3) 1 day ago} set{VAR3, count(close above pp_3,1)} set{VAR4, count(close below r_3,1)} set{WAIT, VAR3 * VAR4} set{BUY, var3 - wait} set{SELL, var4 - wait} draw T3(14,0.5) draw TEMA on plot price draw DEMA on plot price draw TSI(6,3,3) and close is greater than high 1 day ago and draw MACD(12,26,9) and draw ADX(14) and draw CCI(14) with horizontal line 0 and draw Williams %R(14) with center line -50 and draw full Stochastic(14,3,3) with horizontal line 50 and draw OBV and draw RSI(15) and draw LRS(20) and draw Bollinger(20,2) and draw Aroon Down(25) and aroon up(25) and draw ROC(10) with center line 0 and draw Average Volume(10) and draw Absolute Volume Oscillator(15,60) and draw VROC(20) and draw CMF(20) and draw Resistance Line(45,15,2) and draw Support Line(45,15,2) and average day range (50) is above 3% add column average volume (30) add column average day range (50) and draw ema(9) and draw VWMACD Histogram(12,26,9) and draw PVO(12,26,9) with center line 0 add column separator /*close position within a 1-month price range*/ set{hi1mo,high 1 month high} set{lo1mo,low 1 month low} set{cllo1mo,close - lo1mo} set{hilo1mo,hi1mo - lo1mo} set{diff1,cllo1mo / hilo1mo} set{%gain1mo,diff1 * 100} /*close position within a 2-month price range*/ set{hi2mo,high 1 month high 1 month ago} set{lo2mo,low 1 month low 1 month ago} set{cllo2mo,close 1 month ago - lo2mo} set{hilo2mo,hi2mo - lo2mo} set{diff2,cllo2mo / hilo2mo} set{%gain2mo,diff2 * 100} /*close position within a 3-month price range*/ set{hi3mo,high 1 month high 2 month ago} set{lo3mo,low 1 month low 2 month ago} set{cllo3mo,close 2 months ago - lo3mo} set{hilo3mo,hi3mo - lo3mo} set{diff3,cllo3mo / hilo3mo} set{%gain3mo,diff3 * 100} /*EMA calc.*/ set{return1,%gain2mo + %gain3mo} set{return2,return1 / 2} set{return3,%gain1mo - return2} set{return4,return3 * 0.6667} set{return,return4 + return2} I don't take any credit for this, I haven't done anything except for rearranging and modifying to fit my understanding. Credit should go to 5 guys who posted their scans that allowed me to use bits of each and smash them together..I do love smash burgers though! I still don't understand T3(14,0.5) no idea what it means..haha. All I know it's TEMA? and 14 days x .5 but don't know what 0.5 is used as or a factor of. GLTA -Mansor |
| Mansor 78 posts msg #143741 - Ignore Mansor |
6/6/2018 10:20:33 PM Issues with smashed (i.e: previous post) After coming home, and fooling around with it. I saw few errors: Avg Day Range (50) above 3% & 2 missing columns adr10 & adr30. What is adr%50>3 doing there? no idea & why didn't I add adr10&30 like I listed? Maybe smashing got me high..anyway With the previous one with adr50 > 3%, I am getting 8 picks. With highest adr%50 was lgcy with 9.90% With the new one: without adr%50 that is, AND, adding two commands: that is adr10 & adr30 added now. I am getting 15 picks.. I am still getting lgcy as highest adr30% 10.81 However, I am also looking for xover/cross/d2overt3/tsi6/buy listed as 1, i'm getting insy with adr 30 5.46. I will check tomorrow how these react.. Also, last night running some similar scan. CVSI (Pink sheet) was 2.40, today it ran up to 2.67 after 9:30 and steamed out by 10:10am and went auto pilot downward.. So my understanding is, have a mental number per stock and when I get that number, I pull out. Holding AMD, 52wk high today!! Also, seems like SF is quite quiet now, so I will use this thread for my own purposes and add my thoughts after each day..it's good to have a blog on sf forum. Someone will learn from my mistakes |
| Mansor 78 posts msg #143743 - Ignore Mansor |
6/7/2018 12:39:32 AM After checking out greenonthescreen blog Muddy stated a modified version of run forest run: /* RUN FOREST, RUN for 1 day 8 pct loss, 2 day 10 pct loss or more */ /* and fails */ set{ DayChg1 , day change} set{ DayChg2x , close - close 2 days ago } set{ DayChg2y , DayChg2x / close 2 days ago } set{ DayChg2 , DayChg2y * 100 } set{CCb,days(close is above close 1 day ago,100)} set{CCa,days(close is below close 1 day ago,100)} set{ClxCl , CCa - CCb} set{ pick1 , count( DayChg1 below -7.9999 , 1 ) } set{ pick2 , count( DayChg2 below -9.9999 , 1 ) } set{ pickx , pick1 + pick2 } set{ pickx1 , pickx 1 day ago } set{ pick3 , count( ClxCl below 0 , 1 ) * pickx1 } set{ pick , pickx + pick3 } add column DayChg1 {Day1} add column DayChg2 {Day2} /* Long Profit Percent Statistics Display */ set{volcnt, count(volume above 1000000, 100) } set{volzero, count(volume equal 0, 100) } set{HiOp, high - open} set{Long_Profit, HiOp/open } set{B1A, count(Long_Profit > .01 , 100)} set{B2A, count(Long_Profit > .05, 100)} set{B0010, B1A - B2A} set{F1A, count(Long_Profit > .05 , 100)} set{F2A, count(Long_Profit > .10, 100)} set{F3040, F1A - F2A} set{I100, count(Long_Profit > .10 , 100)} and add column B0010 {1_5} and add column F3040 {5_10} and add column I100 {10___} pick above 0 close is between 1 and 15 average volume(10) above 250000 sort column 10 descending set{total,I100+average day range(10)} and add column total and add column average day range(10) ---------------------------------------------------------------------------- Still trying to incorporate this along with the ones previously stated. If anyone is reading this (man, it seems like I arrived to this party 10 years late) & all I'm finding is ruins..and I am excavating it..or at least, trying to...but, if anyone is reading, and is able to understand this code (Im no pro) so hit me up.. Im just trying to smash them together, so I can use them wisely, with help of PP/r/s & dema tema guidelines. |
| Mactheriverrat 3,178 posts msg #143763 - Ignore Mactheriverrat modified |
6/10/2018 5:19:02 PM 13th_floors first filter works just fine. IMHO raise the adr(30) above say 2.00 market is not otcbb market is not etf Buy trigger could be first day up on ema(13) Prime example on a watch list is ECYT 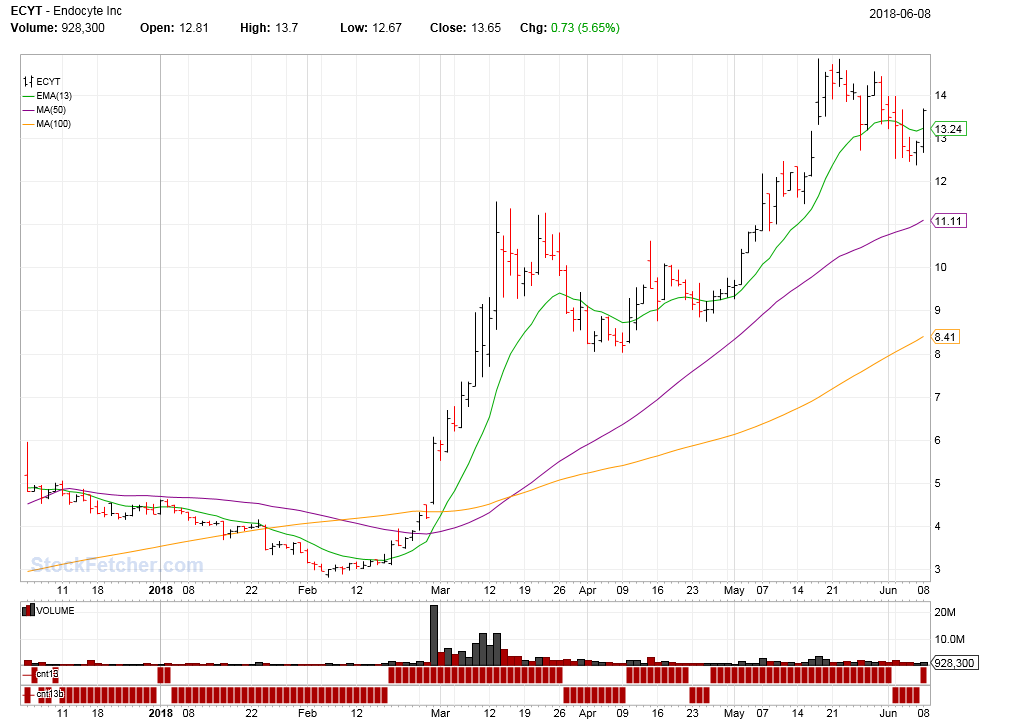 |
| Mansor 78 posts msg #143765 - Ignore Mansor |
6/10/2018 7:37:43 PM Thank you Mac for taking time and going over the scan & suggesting new mods. Over the weekend I got overwhelmed with these countless threads and scans(it seriously takes a toll on eye balls after countless hours of reading, understanding, & decoding each post), but your reply motivated me to keep pushing..so thank you again! |
| Mactheriverrat 3,178 posts msg #143767 - Ignore Mactheriverrat modified |
6/11/2018 12:00:30 AM Your Welcome! Like 13th_floor said raise the adr(30) higher and say volume above 300000. Always keep pushing!!!!!!!!!!!!!! |
| Mactheriverrat 3,178 posts msg #143775 - Ignore Mactheriverrat |
6/11/2018 11:17:12 PM Trading - not every pick goes your way - ECYT nearing breakout level. Bet a a lot of traders will see ECYT pop up on their scans. Then again sometimes stocks have a hard time breaking previous resistance. 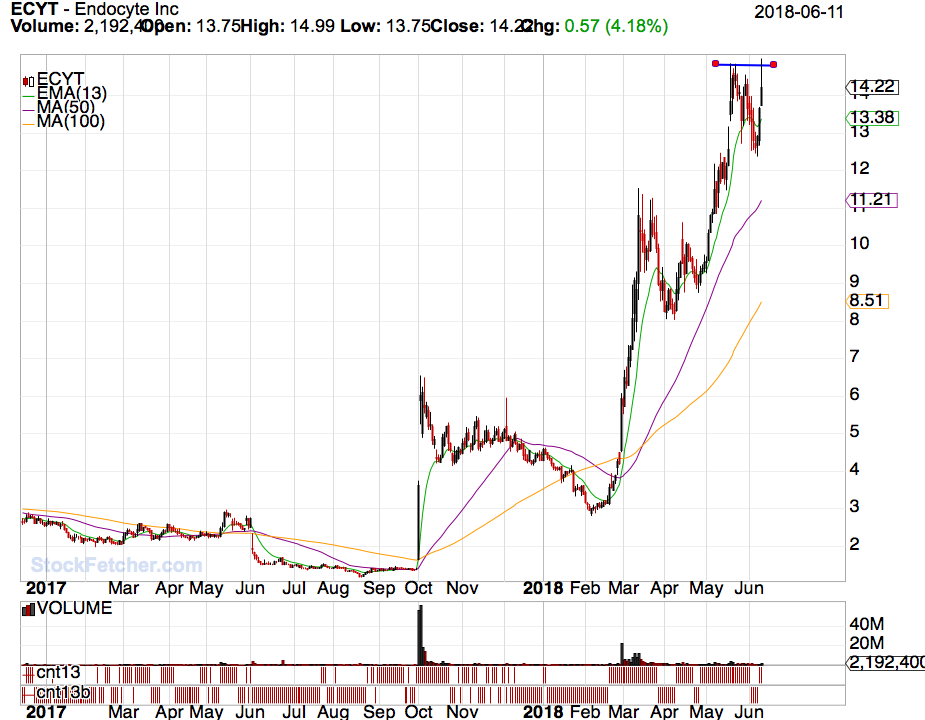 |
| Mactheriverrat 3,178 posts msg #143776 - Ignore Mactheriverrat |
6/12/2018 1:20:37 PM ECYT NICE!!!!!!!!!!!!!!!!!!!!!!!!!!!!!!!!! |
| StockFetcher Forums · Filter Exchange · DEADLY COMBO | << 1 ... 17 18 19 20 21 >>Post Follow-up |