| StockFetcher Forums · Stock Picks and Trading · Technical Warning signs before NASDAQ/FANG sell-off on 9th June 2017 | << 1 ... 2 3 4 5 6 ... 7 >>Post Follow-up |
| karennma 8,057 posts msg #136344 - Ignore karennma |
6/13/2017 4:13:53 PM Re: Fang is in a downward trend .... I don't think so. But like Jim Comey always says, ... "I could be wrong". |
| lonehand 9 posts msg #136346 - Ignore lonehand |
6/13/2017 4:28:18 PM karennma Trading would be more fun if you put some emotion into it. :) |
| karennma 8,057 posts msg #136347 - Ignore karennma |
6/13/2017 4:41:31 PM ROFLMAO! Everyone here knows -- I have an "emotional" problem. And for that reason, I've cut down on my postings because I can drive people nuts. Anyway ,,, re: your post: "what constitutes a new trend ..." ================================== Someone had posted a message on one of the boards with an AMZN chart and a bunch of trendlines. The subject line said, "trend broken" @ $929. I wasn't home Friday at that time, so I missed the action. Apparently, that was an hourly chart. You've brought up a good point about applying trendlines to DAILY charts. Clearly, the uptrend is NOT broken. Thanks for the feedback! lonehand 4 posts msg #136342 - Ignore lonehand 6/13/2017 3:55:05 PM Not trying to be persnickety or over thinking, but how do you define a trend and what constitutes a new trend.In my opinion Amazon is still in an uptrend (No close below major support). Do you define the end of a trend as a break in the trend line on the daily. If so do not understand how a new down trend started unless using a shorter time frame. |
| karennma 8,057 posts msg #136348 - Ignore karennma modified |
6/13/2017 4:50:26 PM never mind. |
| karennma 8,057 posts msg #136349 - Ignore karennma |
6/13/2017 5:07:39 PM I learned something ... I need to start using "daily" charts. |
| lonehand 9 posts msg #136351 - Ignore lonehand modified |
6/13/2017 7:42:34 PM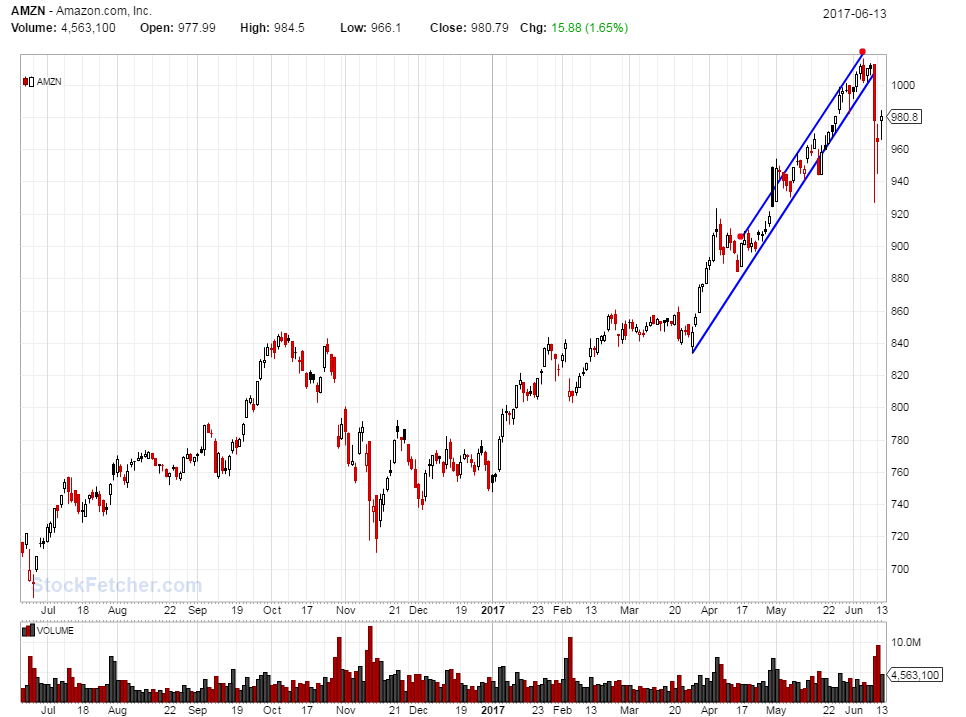  There is different ways to look at trend lines top chart shows trend broken, bottom chart trend is an up channel which would not be invalidated until a close outside the bottom trend line. Neither is a prediction of where amzn price is going. NOBODY KNOWS. It can give you structure for a trade and possible uncle points. Personally I don't use trendlines except on tight flags on a 5 min chart. They always look more obvious after the fact. If someone does use them I am interested in what your methodological is? PS I know that the TL are drawn inexactly ,but close approximation. |
| Mactheriverrat 3,178 posts msg #136353 - Ignore Mactheriverrat modified |
6/14/2017 12:04:26 AM To me if AMZN goes up again today one can use the bottom from June 9th and the bottom of march 29th as new support. Which looks like the uptrend has changed to a higher uptrend meaning every one one else who keeps a eye on AMZN that the uptrend has changed to a higher uptrend. 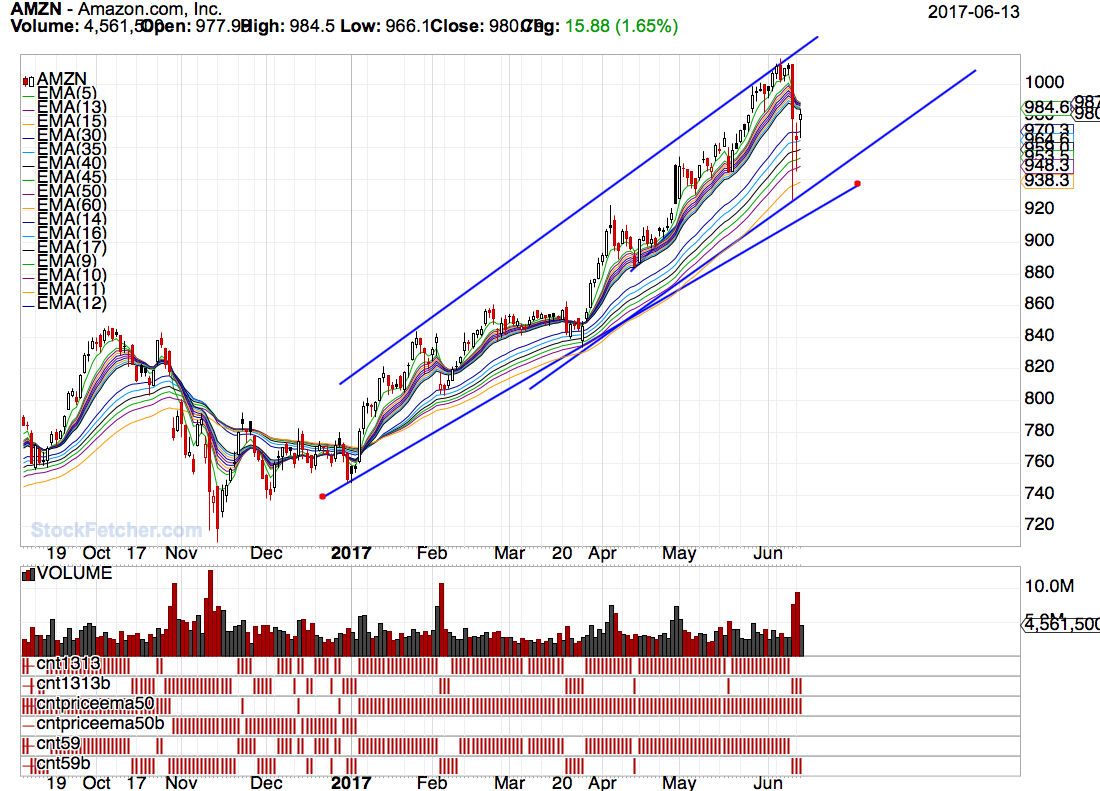 To me with that be said if she goes up the next week or two she will recoup all that was lost (Computer trading that kicked in) and make new highs. The problem is at some point in time she will have another mini- crash ( Computer trading) will kick in. To me the EMA(30) to EMA(60) (Guppy Investors group) suggests that longer term traders are still in. Dented yes but still in. That being said that the Ema(60) line didn't even move down one bit. So when the greedy bastards see she's back into a stronger uptrend will bring in more greedy bastards and higher we go. The greed of wall street never ends. Then again that's good for my IRA. |
| karennma 8,057 posts msg #136354 - Ignore karennma |
6/14/2017 6:59:32 AM lonehand 6 posts msg #136351 - Ignore lonehand modified 6/13/2017 7:42:34 PM Re: "NOBODY KNOWS" ========================== Bingo! Thank G*d I didn't sell NVDA when everyone said it was going lower. That run in May was a windfall. UP in Pre-market: FB AAPL AMZN NFLX GOOGL Mac brings up a good point -- IMHO, this is the time to fear the mini-crash. Flash crashes often occur outside of regular trading hours. That big dump on Friday (AMZN) has me a little worried. Are institutions starting to dump? Or is $1K/shr the new normal? |
| johnpaulca 12,036 posts msg #136356 - Ignore johnpaulca |
6/14/2017 10:00:29 AM
Timeframe: 2hr used for: intraday trading FANG: short signal AMZN: buy signal |
| karennma 8,057 posts msg #136357 - Ignore karennma |
6/14/2017 10:08:08 AM FANG?????? I didn't even know FANG was a stock . LOL! Did you see my post above? When I said "buying FANGs into the close, I guess you thought the "s" was a typo. FANG(s) is the acronym for: AMAZON AAPL NFLX GOOGL My apologies. I assumed everyone knew that. |
| StockFetcher Forums · Stock Picks and Trading · Technical Warning signs before NASDAQ/FANG sell-off on 9th June 2017 | << 1 ... 2 3 4 5 6 ... 7 >>Post Follow-up |