| StockFetcher Forums · Stock Picks and Trading · DUST - Looks ready for Breakout. | << 1 ... 2 3 4 5 6 ... 9 >>Post Follow-up |
| Mactheriverrat 3,178 posts msg #130806 - Ignore Mactheriverrat modified |
9/2/2016 2:16:55 AM $NUGT $DUST Weekly new highs, some Gold stocks well below MA 50 day , some below MA 100 day , every GOLD Guppy Custom Weighted Moving Average (CWMA) from 5 to 15 (short term investor's group is headed south), every GOLD Guppy Custom Weighted Moving Average (CWMA) from 30 to 60 (long term term investor's group is headed south) . For some strange reason I just don't buy it that GOLD is still Bullish. I call $SPY break its BB squeeze to the upside , GOLD dies . OK I will go get some napkins and get ready to eat a plate full of egg on my face day of rants. |
| karennma 8,057 posts msg #130807 - Ignore karennma |
9/2/2016 6:57:18 AM Mactheriverrat 867 posts msg #130806 - Ignore Mactheriverrat modified 9/2/2016 2:16:55 AM For some strange reason I just don't buy it that GOLD is still Bullish. ================================= Just remember, there's short-term and long term. Gold doesn't have to be "bullish". It just has to be tradeable in one direction or another. Erin Heim @ Stockcharts always says(something like) an indicator is a windsock, not a crystal ball. We're just trading "direction" -- whichever way the wind blows. And that is constantly changing ... "Direxion" (ETFs) - Our Leveraged and Inverse ETFs provide opportunities for traders to: Magnify short term perspectives with daily 3x and 2x leverage Utilize bull and bear funds for both sides of the trade. |
| karennma 8,057 posts msg #130808 - Ignore karennma |
9/2/2016 7:10:35 AM We're all just ridin' the wave ... Enjoy! |
| Mactheriverrat 3,178 posts msg #130814 - Ignore Mactheriverrat |
9/2/2016 12:44:40 PM Congrats to all the Long Golds. One thing I want today is the SPY to close up and next week breakout of its Bollinger Band squeeze. One thing I did get out of this whole DUST short term is I recouped almost all my $ that I'm still able to live and trade another day. and that alright by me no matter what. |
| mahkoh 1,065 posts msg #130817 - Ignore mahkoh |
9/2/2016 2:33:14 PM There are 221 stocks in SF database above $125 Of those 148 had a larger daily range than GLD What's the fuss all about? |
| Eman93 4,750 posts msg #130820 - Ignore Eman93 modified |
9/2/2016 6:48:06 PM Almost on Q the trade was to buy the dip in the bullish trending gold at 1306. Always go with the trend when swing trading. DUST gaped down and then ran to previous resistance 35.50 pretty close never made it to 36.50, thats where you buy some NUGT or short DUST. I scalped some beer money and picked up some FCX for a swing at $10.45.  |
| Eman93 4,750 posts msg #130821 - Ignore Eman93 |
9/2/2016 7:00:19 PM this is a bullish chart. Will the trade be a winner who knows..but the odds are better to be long here than trying to short here. you need to be like Sargent Friday.. just the facts and be impartial.  |
| Mactheriverrat 3,178 posts msg #130873 - Ignore Mactheriverrat modified |
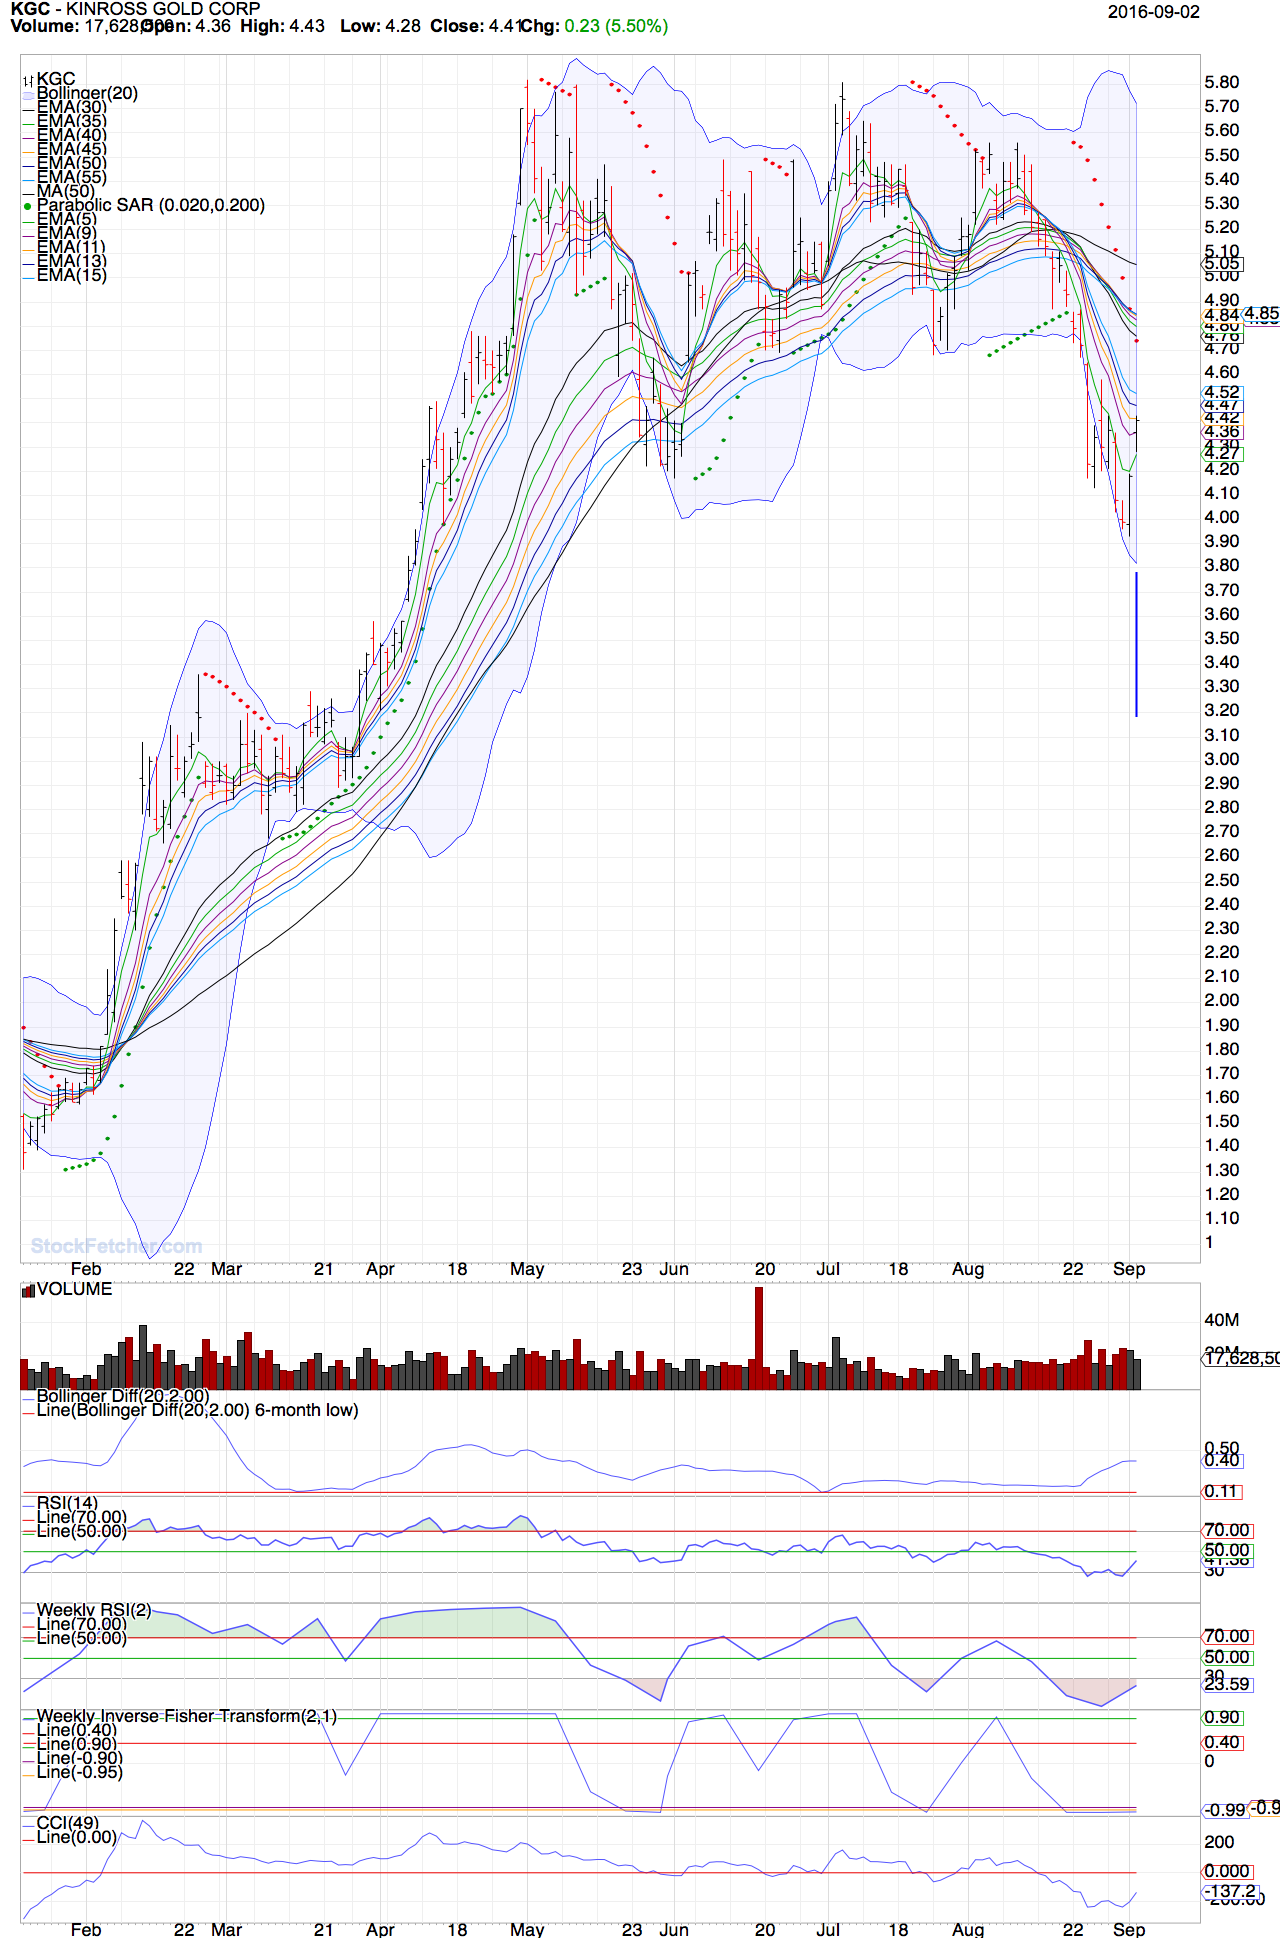
9/5/2016 12:31:32 PM Was I ever wrong. I was using Custom Weighted Moving Averages (CWMA) instead of using Exponential moving averages. Strange but with that change it shows a whole different world of what is long and what I thought was long. To me GOLD stocks are really Bullish as all longer term Exponential moving averages (EMA) are just squeezing and not crossing over as the Custom Weighted Moving Averages (CWMA) showed. The short term group Exponential moving averages (EMA) just were under the longer term Exponential moving averages (EMA) . So I say it a short term oversold GOLD and not a change in longer term direction of GOLD. My bet anything in GOLD could see some sound gains from here. I'm now using the below on my filters and it shows a way better Guppy trading system of the difference of whats long or short . Plus the strength of those to groups. and draw EMA(5) on plot price and draw EMA(9) on plot price and draw EMA(11) on plot price and draw EMA(13) on plot price and draw EMA(15) on plot price and draw EMA(30) on plot price and draw EMA(35) on plot price and draw EMA(40) on plot price and draw EMA(45) on plot price and draw EMA(50) on plot price and draw EMA(55) on plot price |
| pthomas215 1,251 posts msg #130874 - Ignore pthomas215 |
9/5/2016 2:02:12 PM so mac at this point you are thinking I can buy KGC and it wont be similar to catching a falling knife?? ha ha Through EMA's, you think gold is going to rise the way oil fell last year? |
| Mactheriverrat 3,178 posts msg #130875 - Ignore Mactheriverrat |
9/5/2016 2:34:23 PM KGC is very possible to get on that GOLD over sold band wagon. Its long term group averages has rolled over but there is a strong re bound in Gold stocks and ETF where a lot of their long term group averages never rolled over , they just squeezed. Oil I haven't really looked at yet.  |
| StockFetcher Forums · Stock Picks and Trading · DUST - Looks ready for Breakout. | << 1 ... 2 3 4 5 6 ... 9 >>Post Follow-up |