StockFetcher Forums ·  · Shills Corner<< 1 ... 16 17 18 19 20 ... 101 >>Post Follow-up
Mactheriverrat
3,136 posts
msg #142265
Ignore Mactheriverrat
2/15/2018 4:17:27 PM

There are some good Bullish entry points back then.
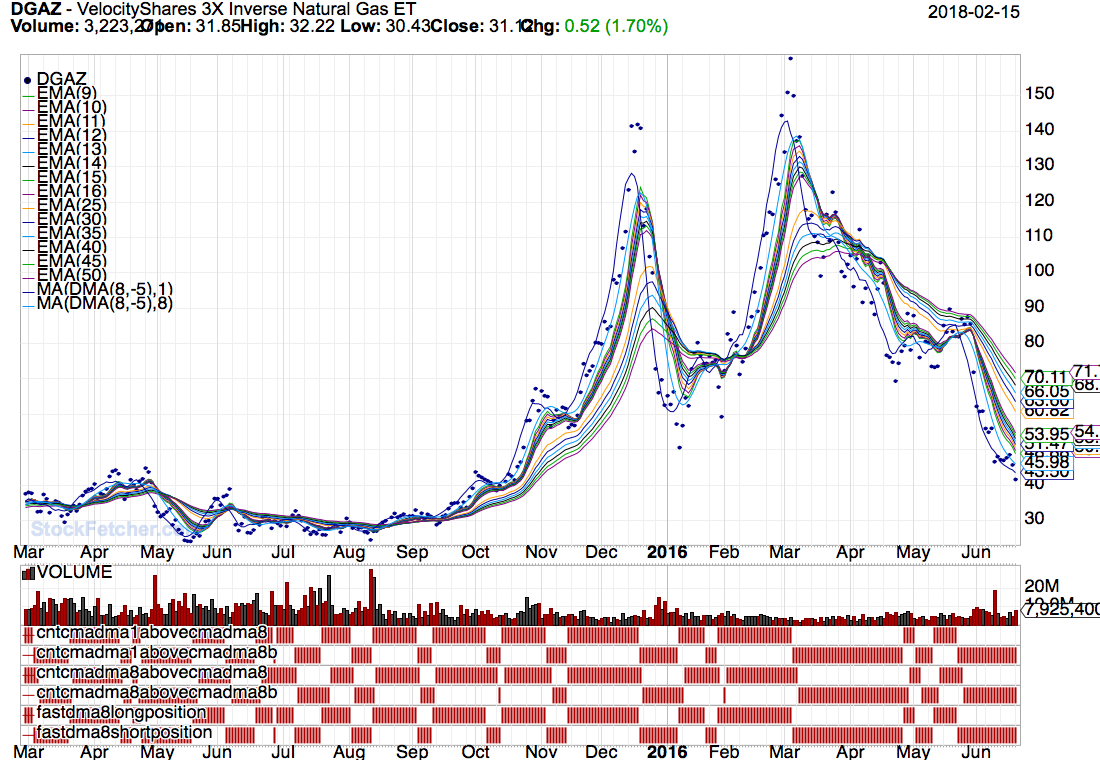


Mactheriverrat
3,136 posts
msg #142266
Ignore Mactheriverrat
2/15/2018 4:19:40 PM

Ugaz - Could see a cross tomorrow - Just saying.
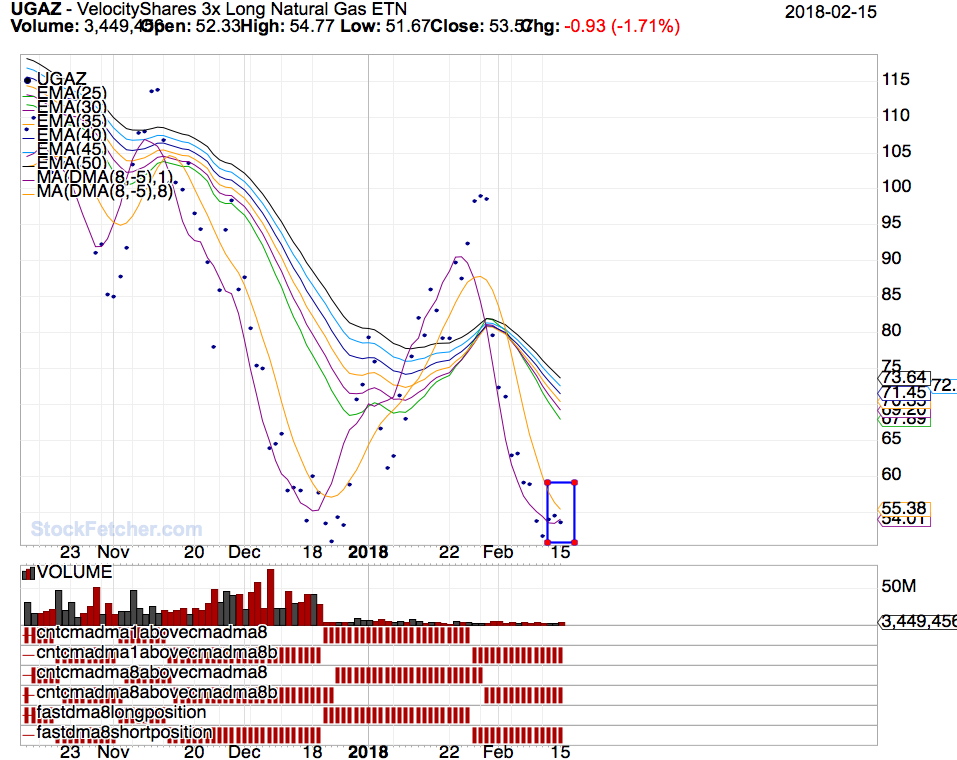


davesaint86
725 posts
msg #142271
Ignore davesaint86
2/15/2018 8:34:50 PM

Thanks for the warning. For a sideways choppy market I could follow the Above the Green Line method (price crosses above Slo Sto(5,1) 20 line and Sell above the 80 line or follow the Ira Epstein method (price crosses MA(18) is a buy and sell at the upper BB(18).

http://stockcharts.com/public/1107832

or

I also have my RSI4/RSI9/RSI30 strategy.

Worst-case scenario can stay out of the market until it starts trending.


shillllihs
5,984 posts
msg #142288
Ignore shillllihs
2/16/2018 2:21:01 PM

Who wants to get in UGAZ early thinking there may be a gap up next week?
Or it could just drop to 0.


Come join Shills and the ever lovely, still very attractive Filipina wife at Sabatinos Italian Restaurant
tonight at 8pm, for live music and great food. I’ll buy you a glass of fine Chianti with a side order of fava beans, thip thip thip...

https://www.yelp.com/biz/sabatinos-restaurant-chicago-chicago

davesaint86
725 posts
msg #142289
Ignore davesaint86
2/16/2018 2:27:22 PM

I jumped in UGAZ this morning with a small position. Let's think realistically. What is the chance of at least a 20% gain from the current price within the next six months? I'm guessing pretty high. I personally think within two weeks.

shillllihs
5,984 posts
msg #142297
Ignore shillllihs
2/16/2018 8:05:31 PM

Looks like gasl gasl already triggered so Ugaz next.

Haven’t looked how linked they are.

pthomas215
1,251 posts
msg #142298
Ignore pthomas215
modified
2/16/2018 8:34:04 PM

i think they are very similar. it seems on a quick study that on a weekly basis UGAZ has a bit less of a movement than GASL. the word is long gas. gold was so confusing the past few days. sure seemed like JNUG was gonna head back up, then DUST looked perfect on a 4 hour chart. I made a rookie mistake...gonna be long DUST most likely on Tuesday.

davesaint86
725 posts
msg #142299
Ignore davesaint86
2/16/2018 9:11:24 PM


Fetcher[
SYMLIST(gasl,gasx,shy)

SET{perf1A, ma(3) 4 days ago}
SET{perf1b, MA(3) / perf1a}
SET{perf, perf1b - 1}
SET{var1, perf*100}
SET{rfr, ind(^irx,close)}
SET{RISKFREERETURN, rfr/100}
SET{perf4, perf - RISKFREERETURN}
SET{STD4, CSTDDEV(CLOSE,4)}
SET{VOL4a, STD4 / MA(4)}
SET{vol4, vol4a * 100}

/*CALCULATION OF SHARPE RATIO - ANNUALIZED*/
SET{SHARPE1a, perf4 / VOL4a}
set{sharpe, sharpe1a * 0.5}

set{var1a, IND(gasl, var1)}
set{var1b, IND(gasx, var1)}
set{var1c, IND(shy, var1)}


SET{RANK1A, COUNT(var1 is above var1a,1)}
SET{RANK1B, COUNT(var1 is above var1b,1)}
SET{RANK1C, COUNT(var1 is above var1c,1)}


SET{RANK1D, RANK1A + RANK1B}
SET{RANK1E, RANK1C + RANK1D}

SET{RANK, 3 - RANK1E}


set{var2a, IND(gasl, sharpe)}
set{var2b, IND(gasx, sharpe)}
set{var2c, IND(shy, sharpe)}


SET{var3a, COUNT(var2a is above 0,1)}
SET{var3b, COUNT(var2b is above 0,1)}
SET{var3c, COUNT(var2c is above 0,1)}


SET{var4a, var2A * var3a}
SET{var4b, var2b * var3b}
SET{var4c, var2c * var3c}


set{var5a, var4a + var4b}
set{var5b, var4c}
set{var5c, var5a + var5b}


SET{allocation1, sharpe / var5c}


set{allocation2, allocation1 * count(sharpe above 0,1)}
set{allocation, allocation2 *100}

draw ema(25)
draw ema(30)
draw ema(35)
draw ema(40)
draw ema(45)
draw ema(50)
and draw Slow Stochastic(14,3) Fast %K line at 20.00 and draw Slow Stochastic(14,3) Fast %K line at 80.00
and draw Slow Stochastic(14,3) Fast %K line at 50.00
and draw Slow Stochastic(5,1) Fast %K line at 20.00 and draw Slow Stochastic(5,1) Fast %K line at 80.00 and draw Slow Stochastic(5,1) Fast %K line at 50.00
draw macd(8,17,5)
set{E4, TSI(5,5,9) - Smoothed TSI(5,5,9)}
set{TDLongposition, count(E4 > 0,1)}
set{TDShortposition, count(E4 < 0,1)}
SET{TDTRIGGER,0}

Set{cntcmadma1abovecmadma8,count( cma(DMA(8,-5),1) > cma(DMA(8,-5),8) ,1)}
draw cntcmadma1abovecmadma8

Set{cntcmadma1abovecmadma8b,count( cma(DMA(8,-5),1)< cma(DMA(8,-5),8) ,1)}

draw cntcmadma1abovecmadma8b

/* AxA is number of consecutive days cma(DMA(8,-5),1) above (+)/below(-) previous cma(DMA(8,-5),8) */
set{AAb,days( cma(DMA(8,-5),1) is above cma(DMA(8,-5),8) ,250)}
set{AAa,days( cma(DMA(8,-5),1) is below cma(DMA(8,-5),8) ,250)}
set{dmax8, AAa - AAb} and add column dmax8 {dma_x_1over8}
do not Draw AxA


Set{cntcmadma8abovecmadma8,count( cma(DMA(8,-5),8) > cma(DMA(8,-5),8) 1day ago,1)}
draw cntcmadma8abovecmadma8

Set{cntcmadma8abovecmadma8b,count( cma(DMA(8,-5),8)< cma(DMA(8,-5),8) 1day ago,1)}

draw cntcmadma8abovecmadma8b

do not draw dma(8,-5),8)


set{E3,dma(8,-5),8)-cma(DMA(8,-5),8) }
set{Fastdma8Longposition, count(E3 > 0,1)}
set{Fastdma8Shortposition, count(E3 < 0,1)}
SET{TRIGGER,0}
draw Fastdma8Longposition on plot
draw Fastdma8Shortposition on plot
draw cma(DMA(8,-5),1)
draw cma(DMA(8,-5),8)
set{E9, close above ma(18)}
set{DLongposition, count(E9 > 0,1)}
set{DShortposition, count(E9 < 0,1)}
SET{DTRIGGER,0}

set{CRS1, rsi(4),1)}
set{CRS2, rsi(9),1)}
set{CRS3, rsi(30),1)}
set{CCRS1, CRS1 + CRS2}
set{CCRS2, CCRS1 + CRS3}
set{CCRS3, CCRS2 /3}


set{CRS4, weekly rsi(4),1)}
set{CRS5, weekly rsi(9),1)}
set{CRS6, weekly rsi(30),1)}

set{WCRS1, CRS4 + CRS5}
set{WCRS2, WCRS1 + CRS6}
set{WCRS3, WCRS2 /3}
set{CWRSI1, CCRS3 + WCRS3}
set{C-RSI, CWRSI1 /2}
set{RSI30, RSI(30) - 50}
set{CRSI_Bar, RSI30}
draw CRSI_Bar
PlotType{CRSI_Bar,zerobar}
set{RSI9, RSI(9) - 50}
set{RSI9_line, RSI9}
draw RSI9 on plot CRSI_Bar
set{RSI4, RSI(4) - 50}
set{RSI4_line, RSI4}
draw RSI4 on plot CRSI_Bar
set{drsilong1, count(rsi(30) above 5, 1)}
set{drsilong2, count(rsi(4) above rsi(30), 1)}
set{drsilong3, count(rsi(9) above rsi(30), 1)}
set{drsilong4, drsilong1 + drsilong2}
set{drsilong5, drsilong4 + drsilong3}
set{drsilong, count(drsilong5 equals 3, 1)}
set{drsishort, count(drsilong5 less than 3, 1)}
SET{DRSITRIGGER,0}
draw drsilong on plot
draw drsishort on plot

set{wrsi1, weekly rsi(4)}
set{wrsi2, weekly rsi(30)}
set{wrsi3, count(wrsi1 > wrsi2,1)}
set{wrsilong, count(wrsi3 equals 1, 1)}
set{wrsishort, count(wrsi3 less than 1, 1)}

set{CRS21, ROC(21,1)}
set{CRS63, ROC(63,1)}
set{CRS126, ROC(126,1)}
set{CR1, CRS21 + CRS63}
set{C-RS, CR1 + CRS126}

set{wsto, weekly Slow Stochastics(14,3)}
set{dsto, Slow Stochastics(14,3)}
set{wdsto, wsto + dsto}
set{CSTO, wdsto / 2}

set{TWRSI4, weekly RSI(4)}
set{TWRSI9, weekly RSI(9)}
set{TWRSI30, weekly RSI(30)}
set{TWRSI1, TWRSI4 + TWRSI9}
set{TWRSI2, TWRSI1 + TWRSI30}
set{A-WRSI, TWRSI2 / 3}

set{TDRSI4, RSI(4)}
set{TDRSI9, RSI(9)}
set{TDRSI30, RSI(30)}
set{TDRSI1, TDRSI4 + TDRSI9}
set{TDRSI2, TDRSI1 + TDRSI30}
set{A-DRSI, TDRSI2 / 3}
set{E10, close above Upper Bollinger Bands(18,2)}
set{BBLongposition, count(E10 > 0,1)}
set{BBShortposition, count(E10 < 0,1)}
SET{BBTRIGGER,0}

ADD COLUMN SEPARATOR
add column BBLongposition{BBSell}
ADD COLUMN SEPARATOR
ADD COLUMN RANK {Rank}
ADD COLUMN SEPARATOR
add column Sharpe Ratio(4) {Sharpe}
add column separator
add column allocation {Alloc %}
add column separator
add column Fastdma8Longposition {DMA8}
add column separator
add column drsilong {drsi}
add column separator
add column TDLongposition {DTSI}
add column separator
add column wrsilong {WRSI}
add column separator
ADD COLUMN ROC(126,1) {6 mth %}
add column separator
ADD COLUMN ROC(63,1) {3 mth %}
add column separator
ADD COLUMN ROC(21,1) {1 mth %}
add column separator
add column C-RS
add column separator
add column Upper Bollinger Bands(18.2) {Up-BB}
add column separator
add column lower Bollinger Bands(18.2) {Low-BB}
ADD COLUMN SEPARATOR
add column weekly Slow Stochastics(14,3){wSto}
ADD COLUMN SEPARATOR
add column Slow Stochastics(14,3){dSto}
ADD COLUMN SEPARATOR
add column csto
ADD COLUMN SEPARATOR
add column A-WRSI
ADD COLUMN SEPARATOR
add column A-DRSI
ADD COLUMN SEPARATOR
add column c-rsi
ADD COLUMN SEPARATOR
add column IFT(4,1) {dift}
add column separator
add column weekly IFT(4,1) {wift}
add column separator

add column rsi(4){drsi4}
add column separator
add column rsi(9){drsi9}
add column separator
add column rsi(30){drsi30}
add column separator
add column RSI(2)
add column separator
add column atr(21) {Atr}
add column separator
add column average day range (21){ADR%}

SORT COLUMN 9 ASCENDING
chart-time is 75 days

]


shillllihs
5,984 posts
msg #142315
Ignore shillllihs
2/17/2018 1:38:08 PM

A good shorting inverse filter.


Fetcher[
symlist(tmv,uvxy,tvix,vxx,vixy,gasx,sdp,drv,drip,ery,ewj,brzs,yang,soxs,vxz,tecs,edz,dust,faz,sdow,spxu,sqqq,tza,jdst,labd,dgaz,sco,dxd,qid)
draw cci(100)
draw cci(100) line at 200
draw cci(100) line at -200
draw cci(100) line at -100
cci(100) crossed below 200
etf
]


shillllihs
5,984 posts
msg #142357
Ignore shillllihs
modified
2/20/2018 1:14:29 AM

Looks like UGAZ up DGAZ down, but who knows.

My system does it again, price above upper bands with a black candle,
Dma coming in later as confirmation. But I’m still having trouble fully understanding. Can someone give me a definitive answer, I feel like I’m hallucinating. Dma can disappear from chart yes?
So if we see a signal that disappeared, should we consider that a prelude to a reversal 100%?
Anyway, I’m in Ugaz 90% and SPxl 10%.


Fetcher[
apply to symlist(DGAZ,SPXU,DRV)
chart-time is 6 months
draw bollinger(20)
draw Aroon Up(25)
draw aroon up(25) line at 90
show stocks where high is above lower Standard Error Band(45,2.0)
etf
and add column stderr(close,45)
draw indposition(OBV,50) line at .80
draw indposition(obv,50) line at .20
DRAW RSI(14)
wdraw rsi(14) line at 35
draw rsi(14) line at 70
draw rsi(14) line at 63
draw rsi(14) line at 30
draw linear regression(10) slope
* AxA is number of consecutive days cma(DMA(8,-5),8) above (+)/below(-) previous cma(DMA(8,-5),8) */
set{AAb,days( cma(DMA(8,-5),1) is above cma(DMA(8,-5),8) ,250)}
set{AAa,days( cma(DMA(8,-5),1) is below cma(DMA(8,-5),8) ,250)}
set{dmax8, AAa - AAb} and add column dmax8 {dma_x_1over8}
do not Draw AxA
Set{cntcmadma1abovecmadma8,count( cma(DMA(8,-5),1) > cma(DMA(8,-5),8) ,1)}
draw cntcmadma1abovecmadma8

Set{cntcmadma1abovecmadma8b,count( cma(DMA(8,-5),1)< cma(DMA(8,-5),8) ,1)}

draw cntcmadma1abovecmadma8b

Set{cntcmadma8abovecmadma8,count( cma(DMA(8,-5),8) > cma(DMA(8,-5),8) 1day ago,1)}
draw cntcmadma8abovecmadma8

Set{cntcmadma8abovecmadma8b,count( cma(DMA(8,-5),8)< cma(DMA(8,-5),8) 1day ago,1)}

draw cntcmadma8abovecmadma8b


draw cntema13aboveema13b
set{E3,dma(8,-5),8)-cma(DMA(8,-5),8) }
set{Fastdma8Longposition, count(E3 > 0,1)}
set{Fastdma8Shortposition, count(E3 < 0,1)}
SET{TRIGGER,0}
draw Fastdma8Longposition on plot
draw Fastdma8Shortposition on plot
draw cma(DMA(8,-5),1)
draw cma(DMA(8,-5),8)
do not draw dma(8,-5),8
]


StockFetcher Forums ·  · Shills Corner<< 1 ... 16 17 18 19 20 ... 101 >>Post Follow-up

*** Disclaimer *** StockFetcher.com does not endorse or suggest any of the securities which are returned in any of the searches or filters. They are provided purely for informational and research purposes. StockFetcher.com does not recommend particular securities. StockFetcher.com, Vestyl Software, L.L.C. and involved content providers shall not be liable for any errors or delays in the content, or for any actions taken based on the content.


Copyright 2022 - Vestyl Software L.L.C.Terms of Service | License | Questions or comments? Contact Us
EOD Data sources: DDFPlus & CSI Data Quotes delayed during active market hours. Delay times are at least 15 mins for NASDAQ, 20 mins for NYSE and Amex. Delayed intraday data provided by DDFPlus


This site is protected by reCAPTCHA and the Google Privacy Policy and Terms of Service apply.