| StockFetcher Forums · Filter Exchange · SPXL DAILY DIRECTION | << 1 2 >>Post Follow-up |
| shillllihs 6,102 posts msg #143065 - Ignore shillllihs |
4/5/2018 11:38:57 AM The ultimate rush would be predicting the market’s direction day to day. So I want everyone of you to start compiling indicators no matter what they are, logical or irrational, to try to predict the next days SPXL direction. I have none, ready go. |
| pthomas215 1,251 posts msg #143066 - Ignore pthomas215 modified |
4/5/2018 1:10:06 PM nice post. SPY is hitting 266.50 and stopping. logical play here would be to buy the vix when the spy hits that level. as always, the IWM vs SPY on % gain will tell you the next move. if IWM daily % gain is higher than the SPY by a decent margin, we are going higher. If IWM % gain is lower than the SPY % (like today), you can short the SPY/long VIX at the end of the day. Im not sure if this chart will post but will try... https://www.tradingview.com/chart/ SPY 30 minute chart shows resistance. i am not yet intelligent enough on posting charts :) |
| shillllihs 6,102 posts msg #143076 - Ignore shillllihs |
4/5/2018 3:45:55 PM I’d be careful following that strategy as it doesn’t hold water. |
| pthomas215 1,251 posts msg #143078 - Ignore pthomas215 |
4/5/2018 3:52:32 PM I've never had an instance where it did not work. But to each his own as they say. Just offering a perspective on how to think about trading the SPY. I think the bigger point is the SPY is resisting at 266.50 right now, so if it blows past it tomorrow for some unexpected reason, we should know we are heading north. |
| shillllihs 6,102 posts msg #143079 - Ignore shillllihs modified |
4/5/2018 4:28:20 PM March 21, iwm led SPy and spy dropped from 170 to 150. Ok, you are using 2 criteria. |
| pthomas215 1,251 posts msg #143080 - Ignore pthomas215 |
4/5/2018 4:40:55 PM I'm really only using 1 criteria. IWM, which is a leading indicator for the market. But to place it in context you have to compare it to the market. I cant see back minute to minute on March 21st, but yes, when IWM has been leading the SPY the whole day with the delta between the two widening, I have never seen the market not go higher. That's because IWM is the leading indicator for the market. |
| Mactheriverrat 3,178 posts msg #143087 - Ignore Mactheriverrat modified |
4/5/2018 11:50:25 PM Trump adds another $100 billion to the trade war. China has yet to play their holdings of our National Debt. This crap could get real. QQQ Guppy Ema(25) cross below EMA(50). According to to Guppy video's when one see's a very narrow range in the long term averages that thing will get explosive - looks like things could go south . IMHO! 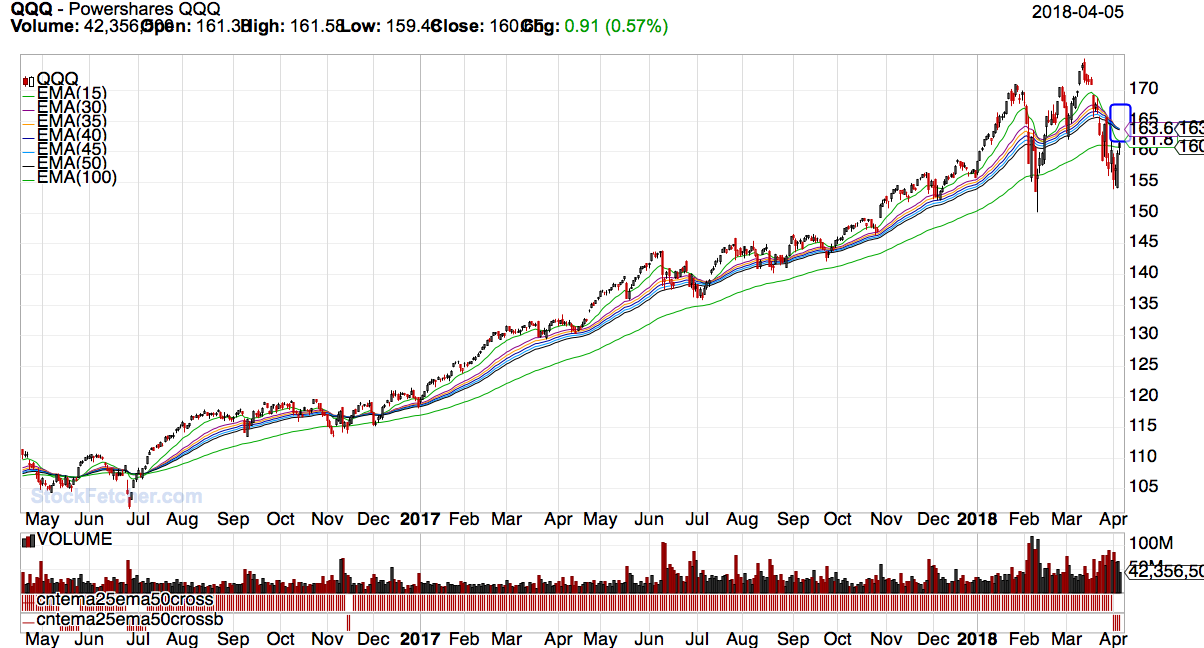 |
| Mactheriverrat 3,178 posts msg #143088 - Ignore Mactheriverrat |
4/5/2018 11:59:16 PM |
| shillllihs 6,102 posts msg #143099 - Ignore shillllihs |
4/6/2018 10:59:22 AM If it’s a bear market it would be an anomaly, for I haven’t seen a bear market with this type of long term set up. So I’m going to say no. And if it is, this is where long term patience comes in and maybe adding to positions. This goes back to the reason I always pump real estate and not relying too much on the stock market to make a living, it’s just too frivolous. |
| Dylan 43 posts msg #143101 - Ignore Dylan modified |
4/6/2018 11:13:25 AM Pthomas, I’m interested in using the IWM/SPY difference as a market tool. However, a few things are still unclear to me from the information you posted. Please point me in the right direction. 1) “As always, the IWM vs SPY on % gain will tell you the next move. if IWM daily % gain is higher than the SPY by a decent margin, we are going higher. If IWM % gain is lower than the SPY % (like today), you can short the SPY/long VIX at the end of the day. Are you only focusing on the difference in delta value between IWM & SPY and NOT price? I ask because on 4/5 at EOD, IWM did not have a lower price gain than the SPY. IWM gained .83% and SPY .79%. 2) “When IWM has been leading the SPY the whole day with the delta between the two widening”. If so, what charting software are you using to monitor the “widening” of the delta values between both securities? If trading view, can you please post a link to your set up, or point me to one I can use? BTW, nice market call today. Thanks! |
| StockFetcher Forums · Filter Exchange · SPXL DAILY DIRECTION | << 1 2 >>Post Follow-up |