| StockFetcher Forums · Filter Exchange · Need Just a Little Help | << >>Post Follow-up |
| davesaint86 726 posts msg #133729 - Ignore davesaint86 |
1/13/2017 9:31:24 PM I would like the filter result to draw the rsi(30) line on the rsi(9) plot. For some reason it's not doing it. What is the workaround. Thanks! |
| four 5,087 posts msg #133730 - Ignore four modified |
1/13/2017 11:13:31 PM rsi(9) crossed above rsi(30) and average volume above 1000000 and close above 10 and draw RSI(30) line at 50 and Draw RSI(30) on plot RSI(9) 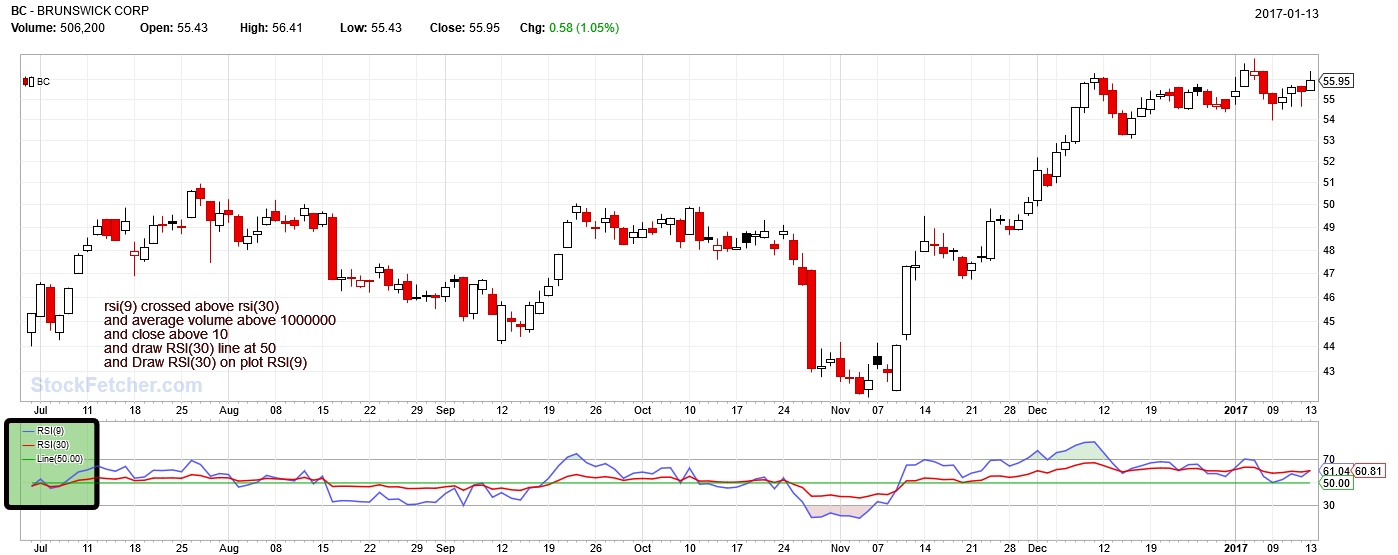 |
| davesaint86 726 posts msg #133731 - Ignore davesaint86 |
1/13/2017 11:56:53 PM Thank you Four. I ran your filter and it still was not working for me (seeing the RSI-9 on the plot. I checked my settings and noticed that I had added a RSI(30) indicator. I deleted it out of my settings and now it works. Thanks. |
| four 5,087 posts msg #133732 - Ignore four |
1/14/2017 12:22:50 AM glad it works... how are you using the filter for trades? |
| davesaint86 726 posts msg #133740 - Ignore davesaint86 modified |
1/14/2017 7:23:16 PM Four - I use the rsi(9)over rsi(30) more as a secondary swing trading indicator and as a momentum indicator. I learned about it on http://www.stocktiming.com/. Right now I'm in CLF, TMF, UPRO and IWM. I like to look for stocks or ETFs in in uptrend. I wait for the pullback and try to go in when the Slow Sto (5.1) crosses above 20. If it is a really strong move like the one you seen in Clf last week the rsi9 goes above the rsi30 fairly quickly. I use the weekly Inverse Transform crossing below 90 to get out. Something new I'm contemplating seeing I can, like TRO states "Milk the Cow" with stocks like CLF. The one month average true range for CLF is is .56. CLF opened 1/13 at 9.55. The low was 9.17. That is a 3.9% drop. The high for the day was 9.78. Big swings. I would think I could place a buy order .25 under the open and a sell order .25 above the opening price and then place a sell order 3% over what paid for it. I also just starting trading a 50/50 split of UPRO and TMF. https://www.tradingview.com/chart/TMF/ceEB72Na-3X-ETF-Strategy-using-UPRO-and-TMF-484-5-return/ I backtested the strategy in ETFReplay. Based on my test results it is a viable strategy. If UPRO were around in 2008 it would have be slaughtered and TMF would have done really well. For my 401k strategy, I buy the top 3 month fund. The results for holding that one fund quarterly beats holding and rotating the highest rated fund monthly. By the way the Kevin from Georgia Allocation% TAA Rank strategy comes in handy for not only one's 401k but also for strategies like (UPRO/TMF/SHY), (TMV,TMF,SHY), (XIV,VXX,SHY) etc. The UPRO/TMF/SHY allocation filter would have had you out of UPRO before it go slaughtered. |
| StockFetcher Forums · Filter Exchange · Need Just a Little Help | << >>Post Follow-up |