StockFetcher Forums · Stock Picks and Trading · Generic<< 1 ... 58 59 60 61 62 ... 63 >>Post Follow-up
four
5,087 posts
msg #134970
Ignore four
3/16/2017 9:30:28 PM


StockFetcher Forums · Filter Exchange · Best of Four << >>Post Follow-up
aferguson3
9 posts
msg #114024
- Ignore aferguson3 6/10/2013 3:54:12 PM

fisher transform(5) and williams %R(90)

Fetcher[
draw fisher transform(5) crossed below -1.9
draw williams %R(90) above -30
draw williams %R(90) line at -30
and close is between 10 and 100
volume above 321321
offset 1

add column annual dividend yield > 2
]


Small Candle Sits Above MA(20)

Fetcher[
close is less than 0.5 percent above ma(20)
open is less than 0.5 percent above ma(20)
close above ma(20)
open above ma(20)


Close is above Day Position(0.80,1)
Open is above Day Position(0.80,1)
open near close
do not draw Day Position(0.80,1)
]


"The Best Short 1"

Fetcher[
symlist(svxy,vixy)
draw ema(13)
draw ema(50)
chart-length 12 months
]


"The Best Short 2: Quilln"

Fetcher[
symlist(EWJ, EWV )
draw ema(13)
draw ema(50)
chart-length 7 months
]


Not sure the name

Fetcher[
symlist(abx,agu,cni)
draw ema(13)
add column annual dividend yield
/*Add your criteria*/
]


Weekly RSI(2)

Fetcher[
Show stocks where Weekly RSI(2) is below weekly RSI(2) one day ago
And Weekly Williams %R(2) is above Weekly Williams %R(2) one day ago
And average daily volume(90) is above 100000
And close is between 5 and 20
And volume is 50% above average daily volume(90)
And add column industry
]


Trading ^SPX closing prices

Fetcher[

set{spx_close, ind(^SPX,close)}
draw cma(spx_close,15)

/* --------- Commented Out ---------

set{spx_ma200, ind(^SPX,MA(200))}
set{spx_ma50, ind(^SPX,MA(50))}
set{spx_cci10, ind(^SPX,CCI(10))}
show stocks where close is above 10.0
and MA(50) crossed above MA(200)
and draw spx_close
and draw spx_ma200 on plot spx_close
and draw spx_ma50 on plot spx_close
and draw spx_cci10
*/
]


Average crosses that happen above another average in the last week- HELP?

Fetcher[
ema(8) 5 days ago crossed above ema(21) 5 days ago
ema(8) 5 days ago greater than ema(55) 5 days ago
ema(21) 5 days ago greater than ema(55) 5 days ago
]


how do I make it so that I get stocks that are in the green one day even though I have data offset for 1 day? Thanks

Fetcher[

close 1 day ago > open 1 day ago

show stocks where high is less than 10% below resistance(65,10) and resistance(65,10) is above 0
and stochrsi(14) is above 0.66
and CMF(4) is above CMF(4) one day ago
and CMF(4) is above CMF(4) two day ago


volume is above 140000
average volume is above 140000
Draw average

and sort column 7 descending


Draw stochastic %k(5,5,3)
draw macd histogram(12,26,9)
draw resistance(25,12,2)
draw resistance(45,15,2)
draw resistance(65,10)
]


Not enough mechanical system experience

Fetcher[
draw rsi(7) line at 40
draw cci(7)
draw rsi(100) line at 50
and apply to sharedlist(da)

draw ma(50)
/*ENTRY
..long
rsi2 below 25 and rsi50 above 50
close above ma(50)
..short
rsi2 above 75 and rsi50 below 50
close below ma(50)
*/
]


Deeply oversold mean-reverting setup for day trading

Fetcher[
/* (WallStreetGenius PRO CUSTOM) */


volume > 500000

draw MA(20)
draw ma(50)
draw ma(100)
draw ma(200)
draw ma(250)

Show stocks where low is near the bottom linear regression line(60)
And rsi(2) is < 30
And average volume(30) is above 50000
And 60-day slope of close is above 0
And close is between 1 and 250
And Chaikins Volatility(10,10) has been decreasing for 1 day

add column RSI(10)
add column Fast Stochastics(14,10)
add column Williams %R(10)
add column Chaikins Volatility(10,10)
sort column 7 descending
add column ind
]


How to filter for newer issues with less data base history

PBF Energy

Fetcher[
close 100 days ago <= 0

close > 10
volume > 123123
]


Dow 30

Fetcher[index is dow 30]


struggling with creating custom indi

Fetcher[
set{v1, close - close 10 days ago}
set{absv1, abs(v1) / atr(10)}
draw absv1
]


Volume is two times greater than average volume

set{x, 2 * average volume(50)}
volume >= x
add column x

Question: Creating a index filter

Fetcher[
ind(spy,close) above ind(spy,ma(75))

symlist(spy,a,aa)

]


Indexes

Fetcher[
cmo(3) < -99
cma(cmo(3),9) < -60
close > 12
volume > 123123
add column annual dividend yield
sort column 5 descending
]


MACD - StockFetcher plot compared to Yahoo Finance

Fetcher[
symlist(aapl)
draw macd(12,26,9)
draw macd(26,12,9)

]


smooth rsi2 and cci5

Fetcher[

set{x, max(rsi(2) 2 days ago,rsi(2) 1 day ago)}
set{xx, sum(x,3) / 4}
draw xx between 20 and 30
draw cci(5) < -100
close > 12
volume > 1231231
add column annual dividend yield
]


macd(8,9,1) and cci(21)

Fetcher[

draw rsi(100)
draw rsi(21)
draw rsi(14)
add column annual dividend yield
close > 12
volume > 123123
draw cci(21) below -90
draw macd(8,9,1) > macd(8,9,1) 1 day ago
draw macd(8,9,1) 2 days ago > macd(8,9,1) 1 day ago
draw macd(8,9,1) < -.05


]


Williams %R(5) and Bollinger %B(7,1)

Fetcher[
bollinger %B(100,1) above cma(bollinger %B(100,1),100)
close > 12
volume > 1231231
williams %R(21) crossed above -75
]


Simple Q: How to create an individual symbol as a filter (not used as a comparison)

Fetcher[

set{spc, ind(spy,close)}
set{x, count(spc > cma(spc,200),1)}

add column x equals 1
RSI(14) is below 20
draw cma(spc,200)

close > 1
avgvol(2) > 123123


]


particular statistics of closing green or red

Fetcher[
symlist(spy)
draw ma(3)
chart-length is 10 days
/* date: 12/21/12 to 1/7/2013 */

set{opma, count(open < ma(3),1)} and draw opma
set{opma10, count(open < ma(3),10)} and add column opma10

set{green, count(close > open,1)} and draw green
set{green10, count(close > open,10)} and add column green10

set{both, opma * green} and draw both

set{bothc, count(both equals 1,10)} and add column bothc
]


Ultimate Oscillator Filter?

Fetcher[
draw Ultimate Oscillator (4,8,16)

set{x, count(close < close 30 days ago,1)}
x > 0
set{xx, count( Ultimate Oscillator (4,8,16) > Ultimate Oscillator (4,8,16) 30 days ago,1)}
xx > 0
]


Suppress 'x' and 'xx'


Fetcher[
draw Ultimate Oscillator (4,8,16)

set{x, count(close < close 30 days ago,1)}
x > 0
set{xx, count( Ultimate Oscillator (4,8,16) > Ultimate Oscillator (4,8,16) 30 days ago,1)}
xx > 0

do not draw x
do not draw xx
]


Intraday Alerts

Fetcher[
set{diff1, MACD Fast Line (12,26,9) - MACD Slow Line (12,26,9) }
abs(diff1) < 0.25
draw RSI(2) < 25
set{diff, close 1 week low - close 52 week low}
abs(diff) < 0.25
low < close 52 week low
close > 12
volume > 123123
add column annual dividend yield
]


MACD Query help

Fetcher[
set{diff1, MACD Fast Line (12,26,9) - MACD Slow Line (12,26,9) }
abs(diff1) < 0.25
draw RSI(2) < 25
set{diff, close 1 week low - close 52 week low}
abs(diff) < 0.25
low < close 52 week low
close > 12
volume > 123123
add column annual dividend yield
]


Percent below MA for x number of days

Fetcher[
2 day slope of close > 0
draw ma(200)
set{x, ma(200) * .97}
draw x on plot close
set{z, count(close < x,9)}
z equals 9

sp500
]


ma and ema and williams
Fetcher[
draw ema(50) > ma(100) /*strength for long*/


draw ema(5) < ema(50) /*correction*/
close > 12
volume > 123123
draw williams %R(100) line at -60

williams %R(100) > -60 /*strength*/
]


Williams and CCI and RSI

Fetcher[
draw williams %R(50) > -50
draw rsi(4) below 10
draw cci(4)
draw cci(14) < -150
nyse
close > 12
volume > 500123
add column annual dividend yield
]


how to sort my filter results

can get you sorting on column 3 or 4 (Vol).

Chg(%) is the third column...
--- Use: sort column 3 descending
--- Use: DESCENDING or ASCENDING


Fetcher[
close between 5 and 120
and average volume(30) is above 250000
and close is above close 1 day ago
and close crossed above ema(8)
sort column 3 descending
]


90 percent success with this filter

Fetcher[
set{sp,count(market is s&p 500,1)}
set{nas, count(market is nasdaq ,1)}
set{spnas, nas + sp}
spnas above 0.5

stock is optionable and avg vol (90) is above 500000

stock is optionable and
avg vol(90) is 500000 and ma(20) is above ma(50) and price is above ma(50) and price has been decreasing for 3 days and draw ma(20) and draw ma(50) and price is above 10
]


filter for morning star and evening star

Fetcher[
pattern is Bullish Morning Doji Star

]


Fetcher[
pattern is bearish evening doji star

]


MACD DIVERGENCE filter---help please

Fetcher[
10 day slope of macd(12,26,1) is below -.1
10 day slope of ma(5) is above .1
]


GRAVESTONE AND DRAGONFLY DOJI

Bullish Dragonfly Doji

• Pattern is strongest after an established bearish trend
• A candle forms with a very small to almost nonexistent body with a long lower wick
• The lower wick is at least twice as long as the candlestick body
• Little or no upper wick

Fetcher[

Close is above Day Position(0.90,1)
Open is above Day Position(0.90,1)
open near close
close > open

]


GRAVESTONE DOJI

A type of candlestick pattern that is formed when the opening and closing price of the underlying asset are equal and occur at the low of the day.

Fetcher[

Close is below Day Position(0.10,1)
Open is below Day Position(0.10,1)
open equals close

]


Index versus index components

The following indices are available on StockFetcher.: http://help.stockfetcher.com/sfhelp/?id=100229

Example: ^INDU = DOW JONES INDUSTRIAL

Fetcher[

DRAW CMA(IND(^INDU,LOW),30)

DRAW RSI(7) LINE AT 25

DRAW EMA(30)

SYMLIST(DIS,MCD,PG,HD,KO,GE,PFE,CAT,BA,UTX,WMT,XOM,JNJ,WMT,CHV)

]


DMA
Fetcher[

/*draws on price chart*/

draw cma(open,3)


/*draws below price chart*/

set{x, open}
draw cma(x,3)
]


Doji

Fetcher[
set{x, count(close < open,4)}
x > 2
open equals close
high is above open
low is below open
]


DT Oscillator Help

Fetcher[
set {v1,cema(stochrsi(5,8),3) }
set {v2, cema(CEMA (StochRSI(5,8),3),3) }
draw v2 on plot v1

set {v3,weekly cema(stochrsi(5,8),3) }
set {v4, cema(weekly CEMA (StochRSI(5,8),3),3) }
draw v4 on plot v3
]


modified volume, price range and rsi to get results... manually roll these values back toward your original values... to get what you want

Fetcher[

Close between 1 and 1000
and Fast Stochastics Fast %K(14,3) 2 day ago below 10
and Fast Stochastics Fast %K(14,3) 1 day ago crossed above Fast Stochastics Slow %D(14,3) 2 day ago
and RSI(2) 2 day ago below 100
and RSI(2) 2 day ago above RSI(2) 3 days ago
and draw RSI(2)
and count(volume is above 10000,10) above 8
and draw ADX(14,14)

close 1% above close 1 day ago

]


Really Clean and Clear Charts!

Fetcher[

draw roc(14,1)
draw cci(14)
symlist(gasx,gasl)

/*
roc > 0
cci14 cross above 0
*/

]


Short Ideas

Fetcher[
set{x, cma(high,2) - cma(low,3)}
set{xx, low -high}
set{z, x / xx}
z 1 day ago crossed above -2
cci(11) 1 day ago crossed below 150
rsi(14) >= 75

close > 11
volume > 123123
add column annual dividend yield
]


Catch the rsi(2) corner (or a little early)

Fetcher[
set{x, rsi(12) - rsi(21)}
x crossed below -10
close > 12
volume > 123123
add column annual dividend yield > 2
draw rsi(2)
]


RSI Screen not picking stocks over a threshold

close above 10 Versus "over 10"

Fetcher[
show stocks that are optionable
close above 10
price low is at 52 week low
rsi(12) is greater than 30
]


identify Doji like pattern near the 8EMA

1. price between 5 - 150
close between 5 and 150
2. volume above 250,000
volume above 250,000
3. today's candle is a Doji Candlestick , and price is below 8EMA for last 5 days
close equals open
count(close < ema(8),5) equals 5

Fetcher[

close between 5 and 150

volume above 250,000

close equals open
count(close < ema(8),5) equals 5
]


use rsi(2) and scalp 25 cents

Fetcher[
set{z, open - .25}
set{x, count(high > z 2 day ago,100)}
add column x > 80
volume > 123123
close > 10
sort column 5 descending
set{zz,count(z >= low,100)}
add column zz > 80
add column annual dividend yield
rsi(2) < 25
]


Version 2: Requires a minimum of 3 days @ rsi2 < 20

Fetcher[
set{z, open - .25}
set{x, count(high > z 2 day ago,100)}
add column x > 75
volume > 123123
close > 10
sort column 5 descending
set{zz,count(z >= low,100)}
add column zz > 75
add column annual dividend yield

count(rsi(2) < 20,3) > 2
]


Question on Weekly Filters

5 day combo

Fetcher[
set{x, sum(rsi(5),5) / 5}
set{xx, sum(cci(5),5) / 5}
draw x on plot rsi(5)
draw xx on plot cci(5)
sp500
x < 25
xx < -100
close >= open
add column annual dividend yield > 2%

]


aferguson3
9 posts
msg #114025
- Ignore aferguson3 6/10/2013 3:58:16 PM

arna and kcg

perhaps a start here...

Fetcher[
symlist(ARNA)
set{x, count(high < high 1 day ago,7)}
set{xx, count(low > low 1 day ago,7)}
add column x >= 5
add column xx >= 5
offset 8/13/2012
]


Angle of a Moving Average

using SLOPE...

Fetcher[
Show stocks where the 20 day slope of the ma(50) is between 0.001 and -0.001
Show stocks where the 20 day slope of the ema(50) is between 0.001 and -0.001
close > 10
volume > 123123
]


rsi(2) - rsi(3)
Fetcher[
set{x, rsi(2) - rsi(3)}
set{z, abs(x) / rsi(3)}
draw cema(z,5)
add column annual dividend yield > 2%
rsi(2) < 5
z > 0.70
volume > 123123
]


Short Ideas
Fetcher[
draw cci(9) > 150

rsi(9) crossed below 60
not otcbb
close > 12
volume > 123123
]


Long Legged Doji Scan

Fetcher[

Close is above Day Position(0.75,1)
close is below Day Position(0.90,1)
Open is above Day Position(0.75,1)
open is below Day Position(0.90,1)

do not draw Day Position(0.75,1)
do not draw Day Position(0.90,1)
]


Playing with atr and stochastic

Fetcher[
set{x, ema(10) - atr(2)}
draw x on plot close

set{xx, ema(10) + atr(2)}
draw xx on plot close

cci(10) > 0
slow stochastic %k(12,3,3) > 50

sp500
add column annual dividend yield
]


ma and rsi for sp500 comparison

plot the ma(5) of spy on the main chart panel

---

Fetcher[
symlist(spy)
draw ma(5))
]


log : rsi and cci

Fetcher[
set{x, log(rsi(5))}
set{xx, log(cci(5))}
draw x > x 1 day ago
draw xx < .5
sp500
x > 4
add column annual dividend yield
]


Can I filter by industry indexes?

create a symlist() of the indices [using etf].
List: http://etf.stock-encyclopedia.com/category/by-industry.html

Materials = XLB
Semiconductors = SMH

Example:

Fetcher[

symlist(xlb,smh)

draw ma(10)
draw cci(10)
]


My 666 Filter

FYI...

Default: Average Volume(90) is being used

clickable

Fetcher[
rsi(2) below 23
volume below avgvol
close below parabolic sars
open below parabolic sars
close between 2 and 5.21
MARKET CAP BELOW 600000
avgvol BETWEEN 2000000 and 10000000

]


ma and rsi for sp500 comparison

Fetcher[


draw ind(spy,ma(30)) on plot ind(spy,ma(5))
do not draw ma(5)
do not draw ma(10)
do not draw ma(30)
set{ma5, ma(5)}
set{ma30, ma(30)}
ma5 > ma30
draw rsi(10) line at 45
rsi(10) crossed above 45
sp500

add column annual dividend yield
]


RSI(9) < -100 AND CCI(9) > 45

Fetcher[
ADD COLUMN ANNUAL DIVIDEND YIELD > 2%
CLOSE > 12
VOLUME > 123123

DRAW RSI(9) > 45
DRAW CCI(9) < -100
DRAW CCI(9) LINE AT -100

DRAW RSI(9) LINE AT 45

/*
THEN
WATCH FOR THE CCI9 CROSS ABOVE -100 WHILE RSI9 IS BELOW 45
*/
]


DT Oscillator Help
Fetcher[


draw weekly cema(CEMA (StochRSI(5,8),3),3)
do not draw weekly stochrsi(5,8)

draw cema(CEMA (StochRSI(5,8),3),3)
do not draw stochrsi(5,8)

]


Leveraged ETF Filter help
Fetcher[
apply to sharedlist(3x long etf,3X Short ETF)

draw rsi(2) line at 10
draw rsi(2) line at 90

set{b10, count(rsi(2) crossed below 10,1)}
set{a90, count(rsi(2) crossed above 90,1)}

add column separator
add column b10
add column a90

draw b10
draw a90

add column rsi(2) 1 day ago {rsi2 1 day ago}
add column rsi(2)

/* OR - thanks TRO */

set{orx, b10 + a90}
orx > 0
]


aferguson3
9 posts
msg #114026
- Ignore aferguson3 6/10/2013 3:59:05 PM

I don't have time to do all of them or organize it.

But The above is up to page 25 of Four's posts if anyone wants to continue

Cheese
118 posts
msg #114028
- Ignore Cheese 6/10/2013 5:30:31 PM

Wow. Thank you so much !

Cheese
118 posts
msg #114029
- Ignore Cheese 6/10/2013 5:36:30 PM

http://www.stockfetcher.com/forums/General-Discussion/DMA/95480&isiframe=

Fetcher[

dma(10,-5) > cma(DMA(10,-5),10)

low < cma(DMA(10,-5),10)

add column cma(dma(10,-5),10)
add column dma(10,-5)

close > 1
avgvol(22) > 123321

]


According to Four:

buy?
1. price below DMA - and -
2. DMA above MA

four
5,087 posts
msg #135096
Ignore four
modified
3/24/2017 12:59:01 PM
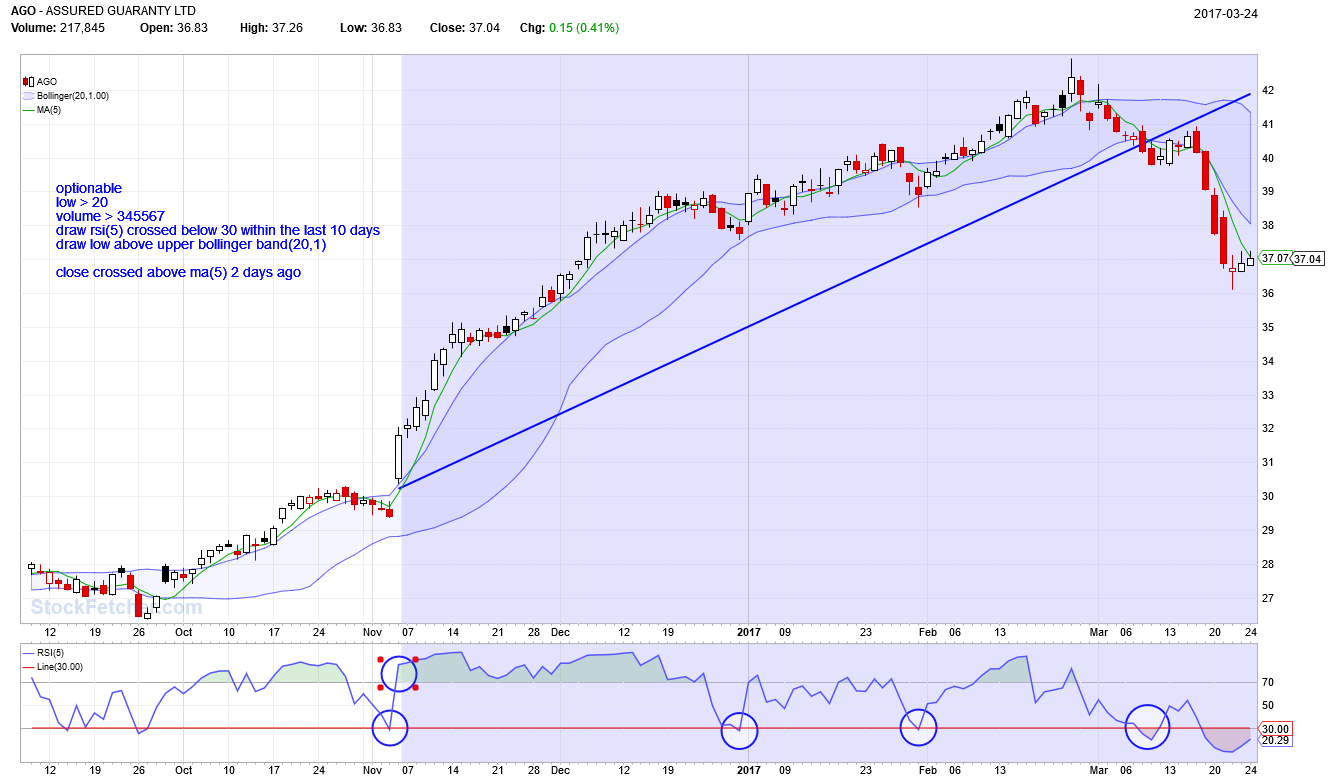
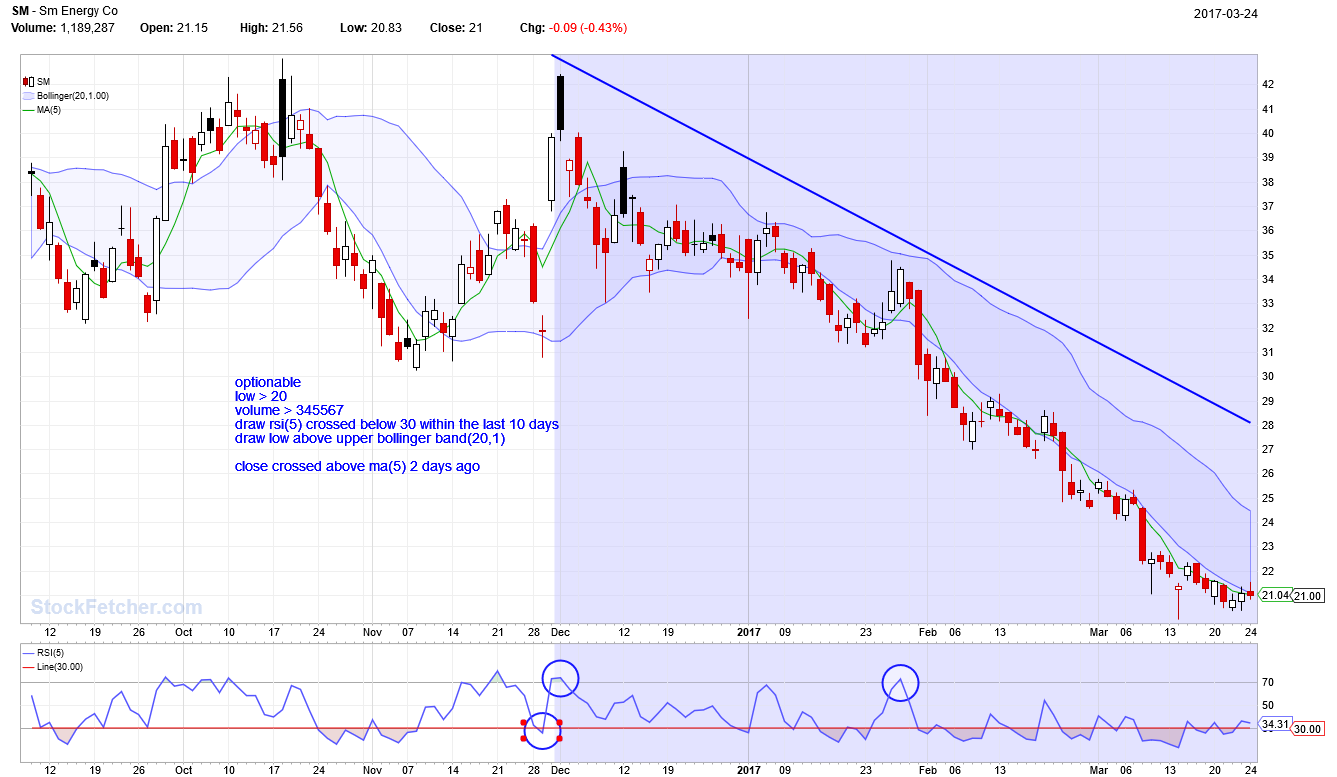


four
5,087 posts
msg #135102
Ignore four
3/24/2017 3:00:29 PM
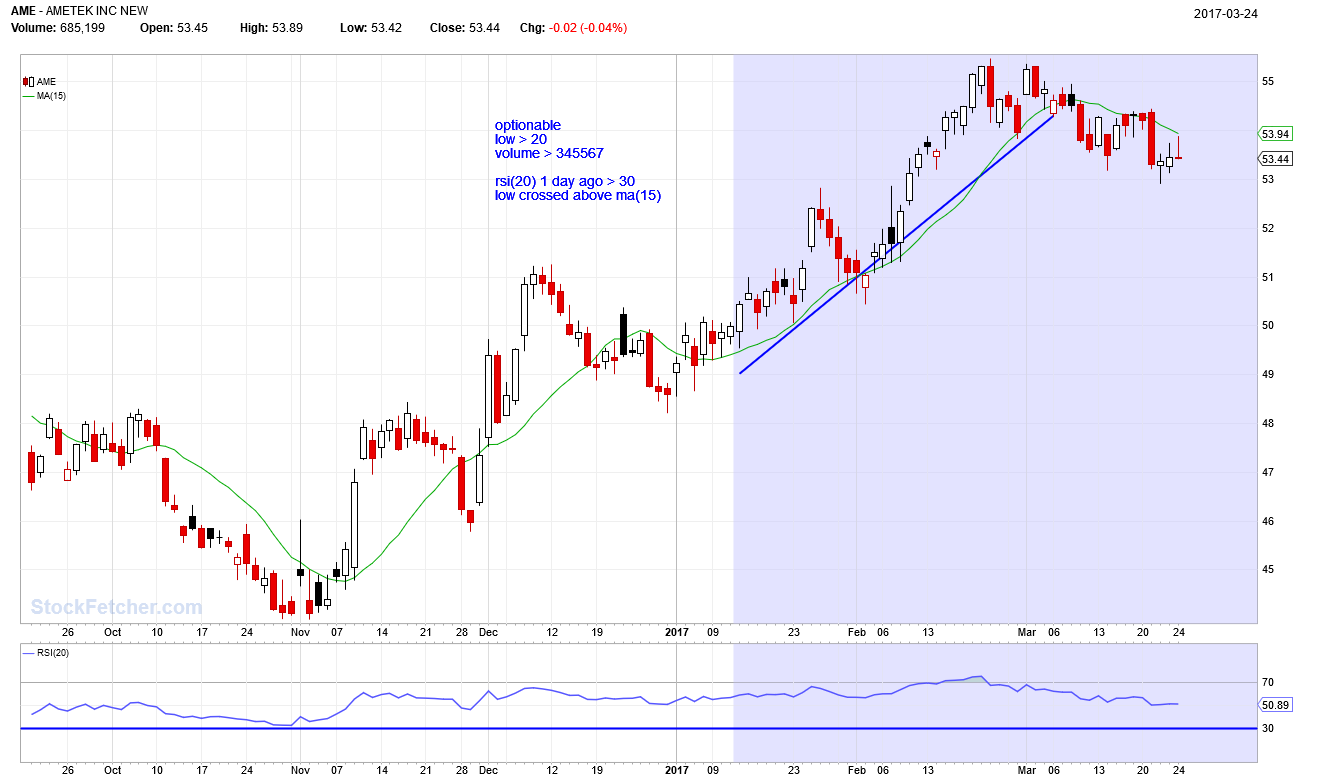


four
5,087 posts
msg #135436
Ignore four
4/14/2017 6:20:18 PM
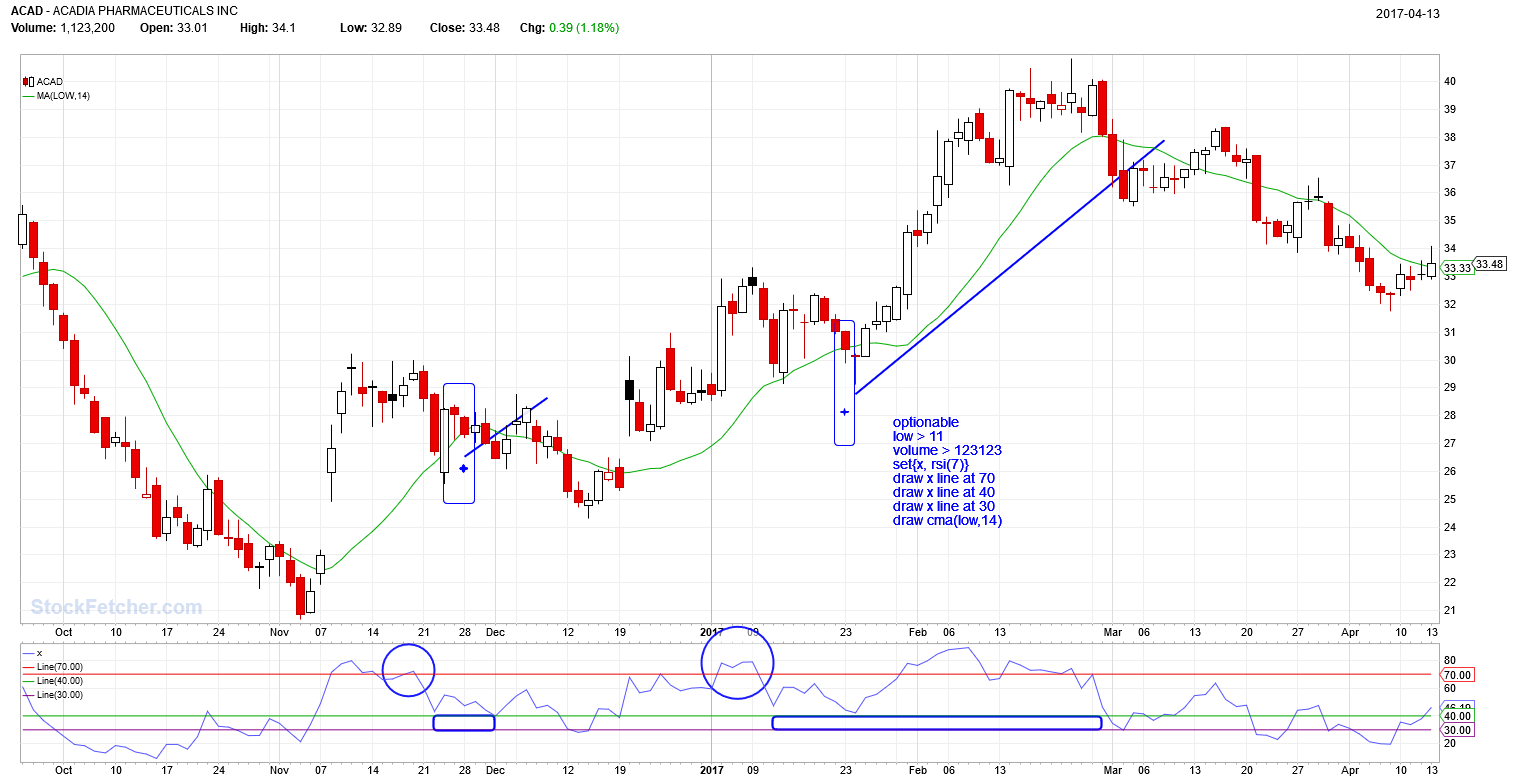


four
5,087 posts
msg #135479
Ignore four
4/17/2017 8:22:17 PM
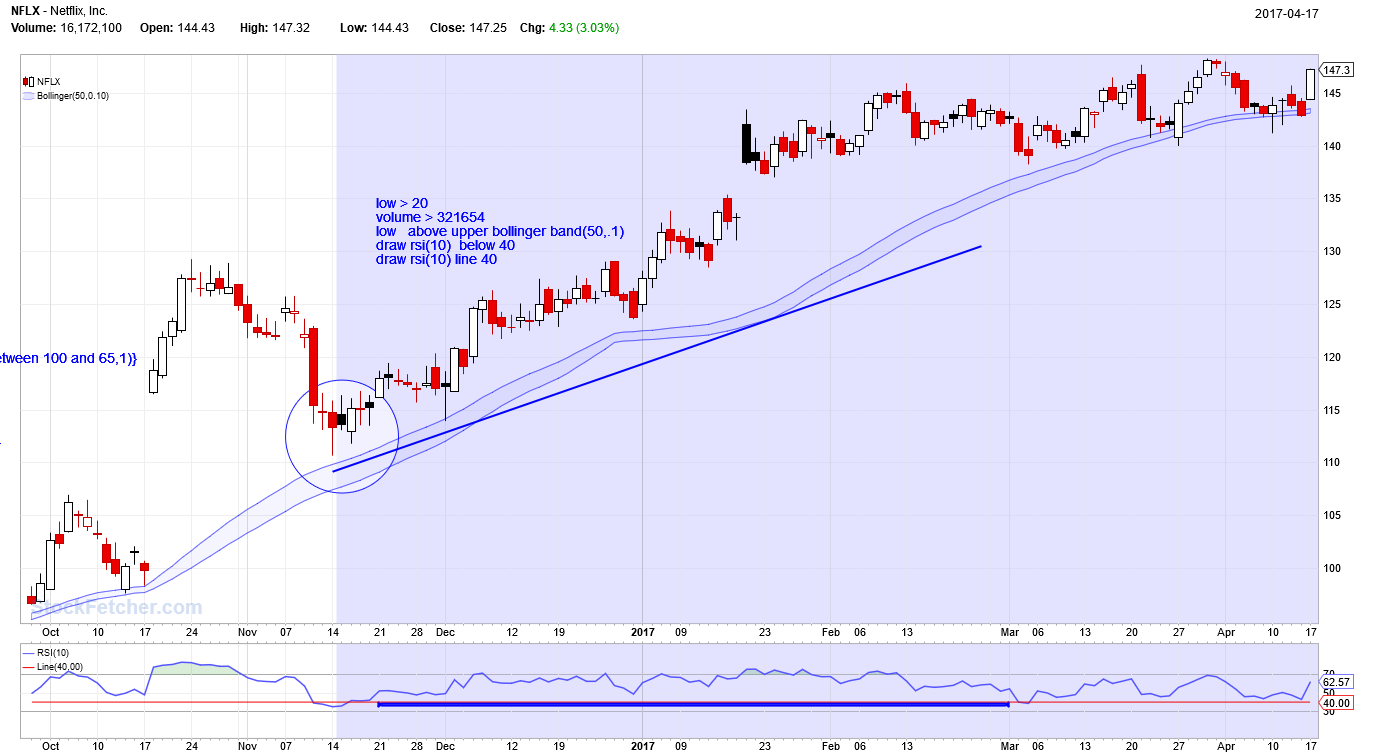

Fetcher[
low > 20
volume > 321654
low above upper bollinger band(50,.1)
draw rsi(10) below 35
draw rsi(10) line 40
add column annual dividend yield
]


four
5,087 posts
msg #135480
Ignore four
4/17/2017 9:18:47 PM
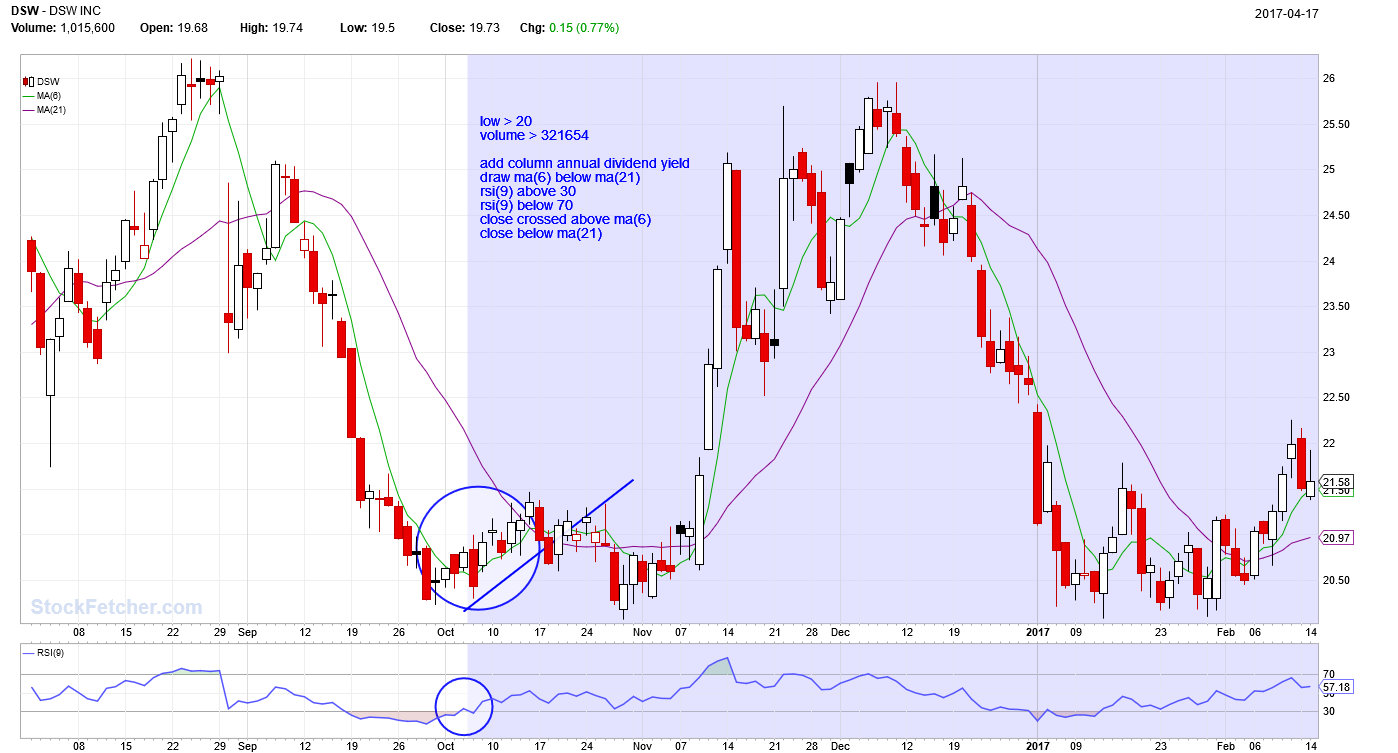
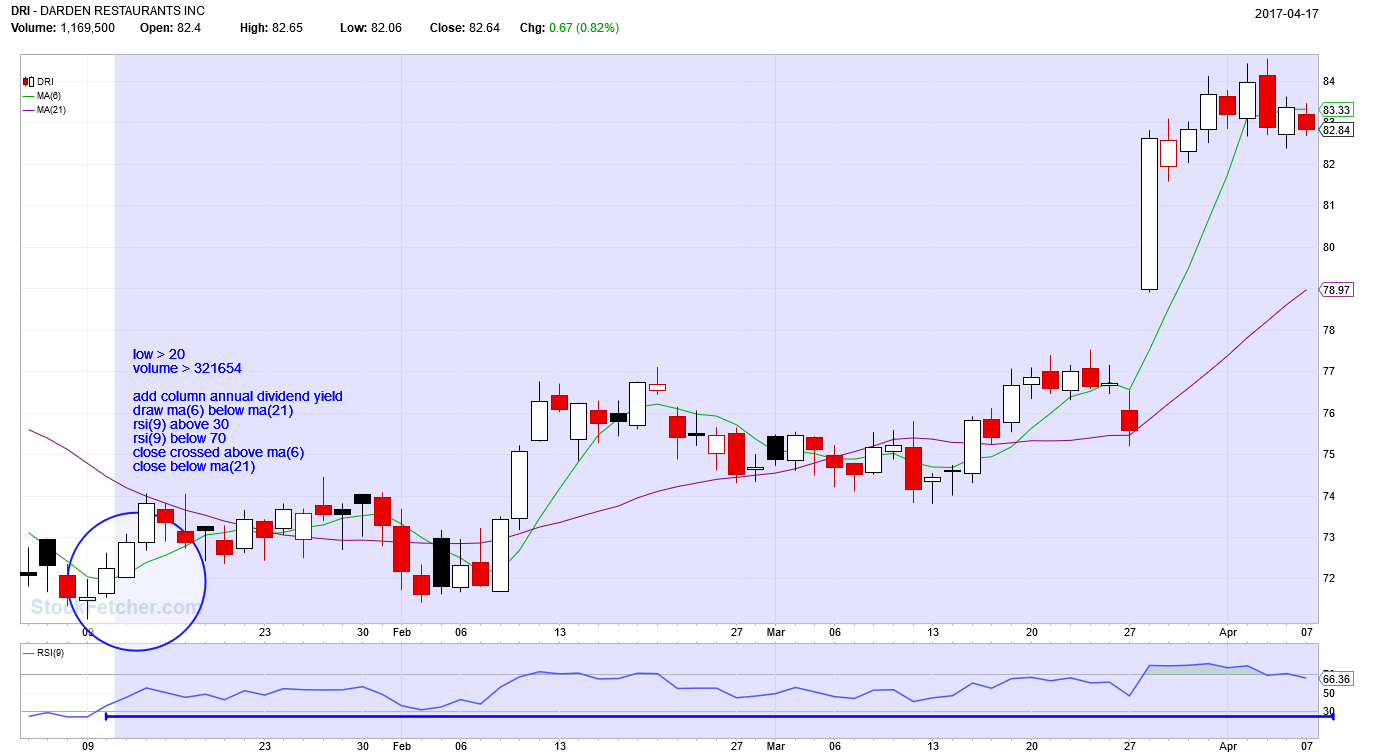


Fetcher[
low > 20
volume > 321654

add column annual dividend yield
draw ma(6) below ma(21)
rsi(9) above 30
rsi(9) below 70
close crossed above ma(6)
close below ma(21)
]


four
5,087 posts
msg #136009
Ignore four
5/21/2017 1:31:04 PM

Trend?
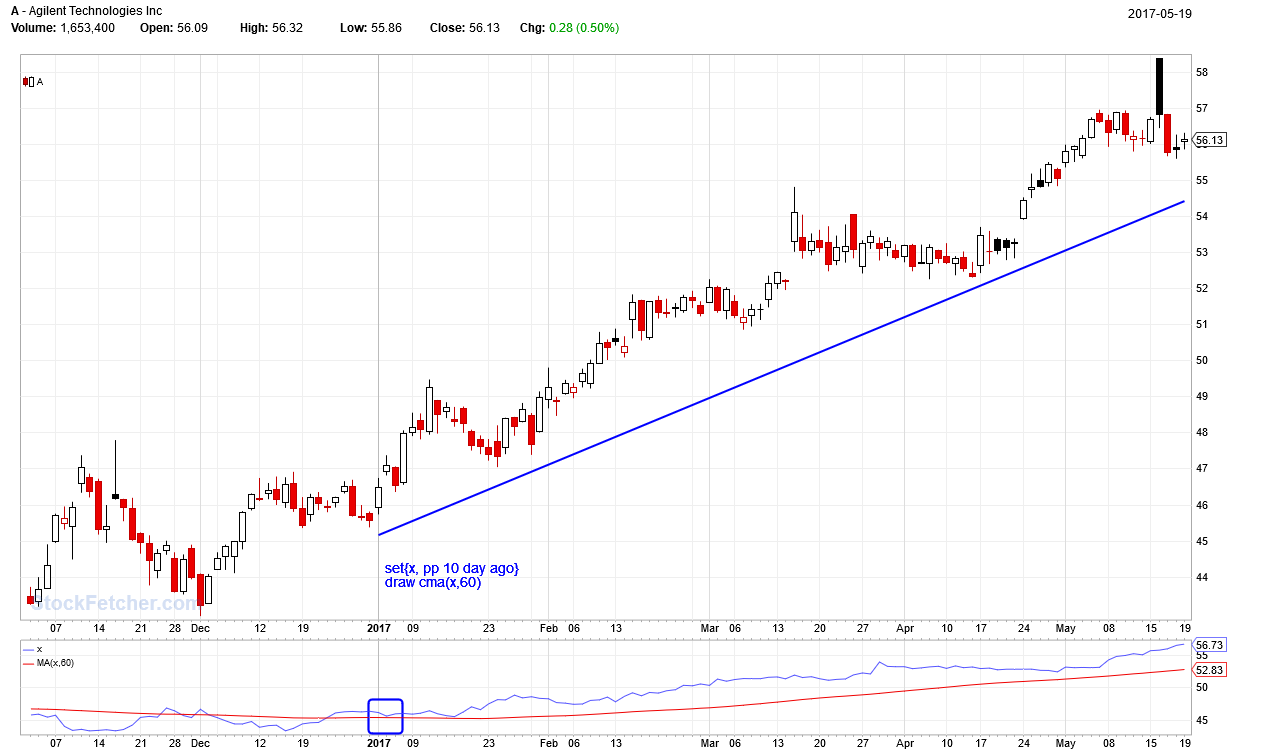


four
5,087 posts
msg #136087
Ignore four
5/27/2017 10:58:39 AM


four
5,087 posts
msg #136088
Ignore four
modified
5/27/2017 11:24:47 AM


Fetcher[
sp100
draw Bollinger %B(40,1.0) line .8
draw Bollinger %B(30,1.0) line 1.5
draw Bollinger %B(30,1.0) line 1.0
add column annual dividend yield
low > 10
volume 1 day ago > 321321
]


four
5,087 posts
msg #136089
Ignore four
5/27/2017 12:05:03 PM


Fetcher[
optionable
low > 10
set{x, rsi(10)}
draw x line
draw x line 30
draw x line 75
draw rsi(5) line 30
draw rsi(5) line 65

rsi(5)crossed below 30 within the last 9 days
x crossed below 30 within the last 9 days

rsi(5) < 30
rsi(5) > rsi(5) 1 day ago
x > 30 and x 1 day ago > 30
draw rsi(14) crossed below 30 within the last 18 days
add column annual dividend yield
]


StockFetcher Forums · Stock Picks and Trading · Generic<< 1 ... 58 59 60 61 62 ... 63 >>Post Follow-up

*** Disclaimer *** StockFetcher.com does not endorse or suggest any of the securities which are returned in any of the searches or filters. They are provided purely for informational and research purposes. StockFetcher.com does not recommend particular securities. StockFetcher.com, Vestyl Software, L.L.C. and involved content providers shall not be liable for any errors or delays in the content, or for any actions taken based on the content.


Copyright 2022 - Vestyl Software L.L.C.Terms of Service | License | Questions or comments? Contact Us
EOD Data sources: DDFPlus & CSI Data Quotes delayed during active market hours. Delay times are at least 15 mins for NASDAQ, 20 mins for NYSE and Amex. Delayed intraday data provided by DDFPlus


This site is protected by reCAPTCHA and the Google Privacy Policy and Terms of Service apply.