| StockFetcher Forums · Filter Exchange · Tight Range | << >>Post Follow-up |
| JohnT328 54 posts msg #143868 - Ignore JohnT328 |
6/22/2018 6:15:16 AM Hi, can someone help me create a filter for a tight price range. What I am looking for is price to have been in a tight range between 0-5% above MA (1) and 0-5% below MA (1) for the last two to 7 days Can someone assist? Thanks |
| four 5,087 posts msg #143874 - Ignore four |
6/22/2018 11:58:39 AM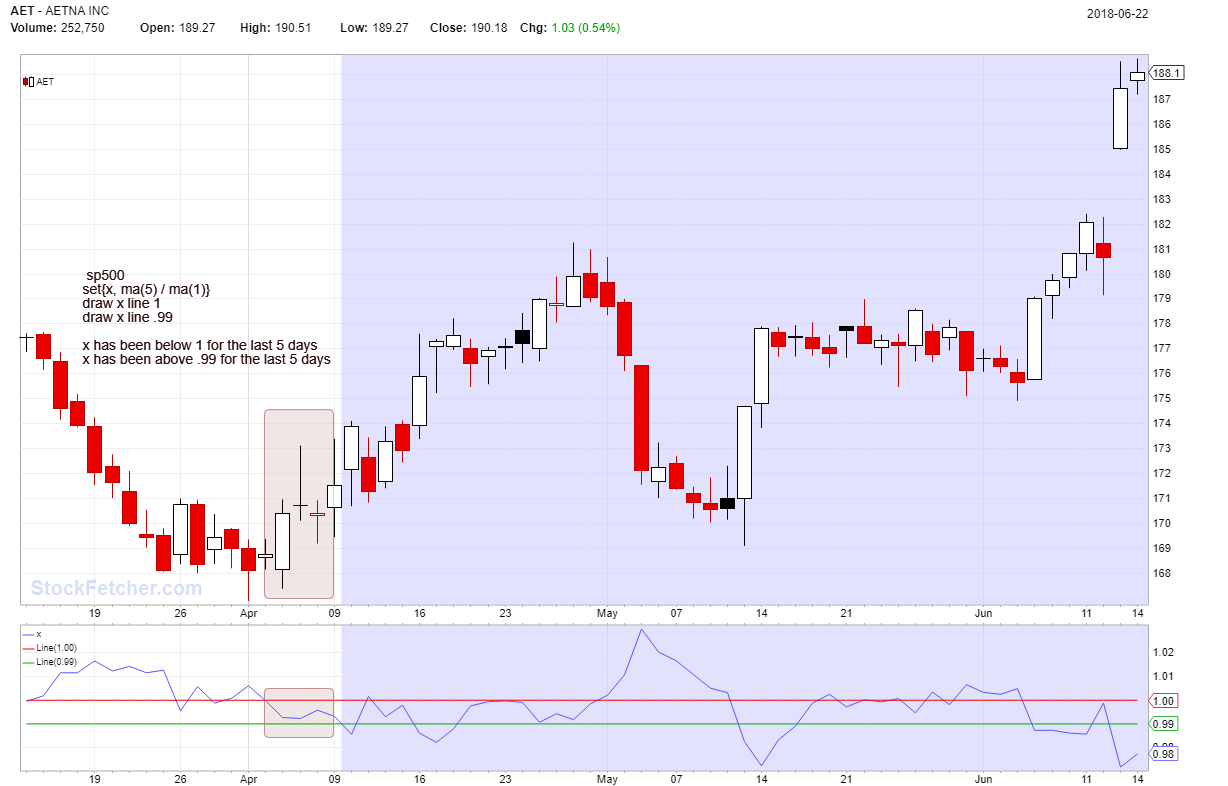 |
| JohnT328 54 posts msg #143887 - Ignore JohnT328 |
6/23/2018 10:49:25 AM First, thank you for the filter. Can you tell me what some of the variables mean because I am not getting the exact results I want and I think I just need to tweak it a little bit. For example, what is the purpose of MA (5) in the filter? Also, what variable/s represent the 0-5% range (I may need to restrict that percentage to 0-2%) Thanks |
| four 5,087 posts msg #143888 - Ignore four modified |
6/23/2018 12:04:39 PM I agree with your observations. MA1 is simply the day's close. I don't consider +- 5% as a tight range over the course of a week. Try different combinations with the previous filter. Individually or both modified at the same time--to reduce the channel width: * try changing the ma5 to ma4 * try changing the values for the width of the channel (replace .04 with .03) -- -- Here is another offer to work with: |
| StockFetcher Forums · Filter Exchange · Tight Range | << >>Post Follow-up |